


































Green Software Development: A Complete Guide to Sustainable, Carbon-Aware Systems

 Share -



- 01How Software Development Contributes to Carbon Emissions
- 02Core Principles of Green Software Engineering
- 03The Software Carbon Intensity (SCI) Standard and Other Frameworks
- 04How to Implement Green Software Development
- 05What Are The Best Practices of Green Software Development?
- 06Demand Shaping and Carbon-Aware Development
- 07Tools Used to Measure Software Carbon Emissions
- 08The Role of AI in Green Software Development
- 09Challenges of Green Software Development
- 10Green Software Development Trends 2026
- 11Ready to Build Carbon-Efficient Software That Performs

Key takeaways:
- Green software treats energy and carbon as core engineering metrics, not an add-on.
- SCI measures carbon per unit of work, so systems can scale without being penalized.
- Three levers drive impact: energy efficiency, hardware efficiency, and carbon awareness.
- Demand shaping adjusts a service in real time based on grid carbon intensity.
- AI is both a major compute cost and a tool for cutting emissions elsewhere.
- Carbon efficiency usually cuts cloud costs too, and is now a factor in enterprise RFPs.
Green software development is the practice of building systems where energy and carbon are engineering constraints, not afterthoughts, measured and optimized with the same rigor teams apply to latency or uptime. It reframes efficient code, smart architecture, and carbon-aware infrastructure choices as core requirements of good engineering, not a separate sustainability initiative bolted on after launch.
Understanding why green software engineering is important comes down to scale: a single inefficient function costs little on its own, but multiplied across millions of executions a day, it becomes a measurable line on both a carbon report and a cloud bill.
The urgency behind this shift is visible in the numbers. Global electricity demand from data centres grew 17% in 2025, with AI-focused facilities surging 50% in the same year, and consumption is projected to roughly double from 485 TWh in 2025 to 950 TWh by 2030, according to the International Energy Agency. Every workload an enterprise ships, from a customer-facing app to an internal AI pipeline, adds to that curve.
Green software engineering, the discipline behind the practice, answers three questions for any system: how much energy it consumes, where that energy comes from, and how much carbon it ultimately produces. Those answers shape real engineering decisions, from which cloud region hosts a workload to how algorithms are structured to how idle compute gets scaled down.
For enterprise buyers, this isn’t purely an environmental conversation. Carbon-aware systems are, almost by definition, leaner systems. Cutting unnecessary compute cycles, optimizing data transfer, and right-sizing infrastructure reduce cloud spend at the same time they reduce emissions, which is why CTOs and CFOs are increasingly asking the same question from different directions.
By 2030, data centers will draw nearly 950 TWh a year, per the IEA. Every workload you ship adds to that curve, build yours to cut through it instead.

How Software Development Contributes to Carbon Emissions
Every piece of software carries a carbon cost, even when that cost is invisible to the team writing the code. Each function call consumes CPU cycles, each database query pulls power from a server rack, and each file stored or transferred draws energy from a data center that, in turn, draws power from a grid still substantially reliant on fossil fuels. Software itself has no physical form, but everything it runs on does.
The Three Layers of Software Emissions
Software’s footprint splits across three technical layers, each with a different lever for reduction:
- Compute emissions – CPU and GPU cycles spent executing logic, training models, and processing requests. This scales with algorithmic complexity: an operation running at O(n²) instead of O(n log n) doesn’t just run slower, it burns proportionally more energy for the same output.
- Storage emissions – power drawn from the disks, RAID arrays, and backup systems holding data at rest. A large share of enterprise storage holds duplicate, stale, or “just in case” data that’s rarely, if ever, read again.
- Network emissions – energy spent moving data between users, services, and data centers. Every unoptimized API payload, uncompressed image, or unnecessary round trip adds transfer overhead that scales with traffic volume.
Direct vs. Indirect Emissions
Not all emissions are created equal, and carbon-aware software development typically separates them into two categories:
- Operational emissions – the carbon generated while software runs in production: server load, cooling overhead, and network transfer during active use.
- Embodied emissions – the carbon already spent manufacturing the hardware a workload runs on. Software that forces frequent hardware refreshes, or that runs inefficiently enough to require oversized infrastructure, inflates this embodied cost even before a single request is served.
Where Inefficient Code Compounds the Problem
Inefficiency rarely stays contained to one server. A poorly optimized algorithm that takes ten times longer to execute consumes roughly ten times the energy for the same output, and at enterprise scale, that inefficiency repeats across millions of requests a day. A few patterns account for most of the avoidable footprint:
- Zombie infrastructure – provisioned servers and cloud instances running at low utilization, drawing power without proportional output.
- Bloated CI/CD pipelines – build and test cycles that run redundant jobs on every commit instead of only what changed.
- Unoptimized data pipelines – ETL jobs and queries that scan full datasets instead of filtering early, multiplying computes for the same result.
- Over-provisioned cloud instances – infrastructure sized for peak load year-round instead of scaling dynamically with demand.
Why This Makes Development an Emissions Lever
This is why software development itself is now treated as a direct emissions lever, not a downstream consequence of hardware or grid choices. Architecture decisions, language selection, and infrastructure providers are made early in a project’s lifecycle, and they lock in a large share of an application’s lifetime carbon cost long before any sustainability team gets involved.
Core Principles of Green Software Engineering
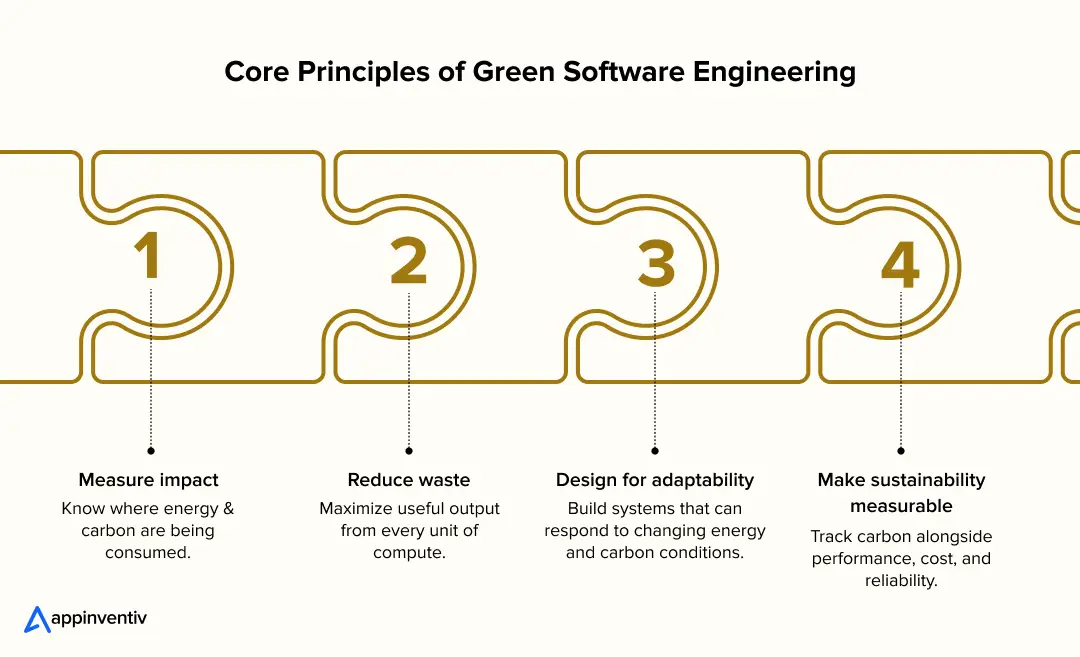
The foundation of sustainable software development comes from the Green Software Foundation’s SCI framework, and they translate into three practical levers engineering teams can act on directly: how much energy a system uses, how carbon-intensive that energy is, and how efficiently the underlying hardware is utilized.
Energy Efficiency
Energy efficiency is about doing the same work with fewer compute cycles. It starts at the code level and extends through the full stack:
- Algorithmic efficiency – choosing data structures and algorithms with lower time complexity, since a faster algorithm is almost always a lower-energy one.
- Caching and memoization – avoiding repeated computation or redundant database calls for results that haven’t changed.
- Lazy loading – deferring resource-heavy operations until they’re actually needed, rather than computing everything upfront.
- Efficient data formats – using compact serialization (protobuf over verbose JSON, for instance) to cut both processing and transfer overhead.
Hardware Efficiency
Hardware efficiency focuses on getting more useful work out of the same physical infrastructure, which reduces both operational and embodied emissions:
- Right-sizing instances – matching compute resources to actual workload demand instead of provisioning for worst-case peaks.
- Autoscaling – dynamically scaling infrastructure up and down with real-time demand, often implemented through horizontal pod autoscaling in Kubernetes environments, rather than running fixed capacity around the clock.
- Containerization – packing more workloads onto shared hardware through containers, improving utilization density versus dedicated VMs.
- Extending hardware lifecycles – writing software that runs well on existing infrastructure, reducing pressure toward frequent hardware refreshes.
Carbon Awareness
Carbon awareness is the principle that distinguishes green software engineering from plain performance optimization. It means factoring in when and where code runs, not just how efficiently:
- Demand shifting – scheduling non-urgent, compute-heavy jobs (batch processing, model training, report generation) for periods when the grid is running on more renewable energy.
- Demand shaping – adjusting the service itself in real time, such as reducing video resolution or model complexity, when the grid’s carbon intensity is high.
- Region selection – deploying workloads in cloud regions powered by cleaner grids, since the same job can carry a very different carbon cost depending on where it runs.
Why All Three Have to Work Together
None of these principles function well in isolation. A perfectly efficient algorithm running on an oversized, always-on instance in a coal-heavy grid region still carries a heavy footprint. Carbon-aware software development treats energy efficiency, hardware efficiency, and carbon awareness as a connected system, one where architecture decisions in one area directly affect the returns available in the other two.
The Software Carbon Intensity (SCI) Standard and Other Frameworks
Green software engineering only works as an engineering discipline if its claims can be measured and compared consistently. That’s the gap the Software Carbon Intensity (SCI) standard, and a handful of adjacent frameworks, are built to close.
What the SCI Standard Measures
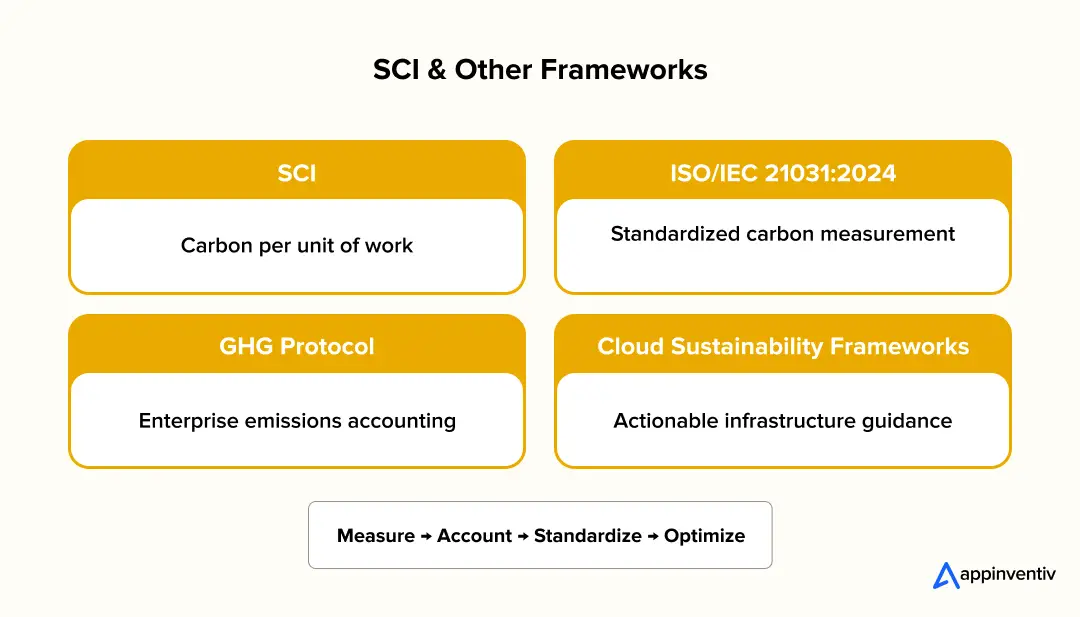
The SCI standard, developed by the Green Software Foundation and formalized as ISO/IEC 21031:2024, defines a rate rather than a total. Instead of asking “how much carbon did this system emit,” it asks “how much carbon does this system emit per unit of work.” The formula is expressed as:
SCI = ((E × I) + M) per R
- E – energy consumed by the software, in kilowatt-hours.
- I – the carbon intensity of the electricity powering that energy, which varies by grid and region.
- M – embodied carbon, the emissions from manufacturing the hardware, amortized over its use.
- R – a functional unit of work, such as per API call, per user, or per transaction.
Expressing emissions as a rate rather than an absolute number is what makes SCI useful for engineering teams. A system that scales to more users should be judged on whether its carbon-per-transaction goes down, not penalized simply for growing.
Why a Rate-Based Standard Matters for Enterprises
Enterprise teams generally can’t reduce total emissions to zero while a business is also growing its user base or transaction volume. A rate-based metric lets carbon efficiency become a target that scales alongside the business, similar to how cost-per-transaction or latency-per-request are already tracked. It also makes carbon a comparable metric across different releases, architectures, or vendor choices, since two systems can be benchmarked on the same functional unit.
Other Frameworks and Standards Guiding Green Software Engineering
SCI sits alongside several other carbon-aware software development frameworks and standards that enterprises typically reference together rather than in isolation:
- GHG Protocol – the broader corporate accounting standard for Scope 1, 2, and 3 emissions, into which software-related emissions typically feed as part of Scope 3.
- Green Software Foundation Patterns Catalog – a maintained, open library of engineering patterns (cloud, AI, web) mapped to measurable carbon reductions.
- ISO/IEC 21031:2024 – the formal international standardization of the SCI specification, giving it the same standing as other ISO-governed technical standards.
- Well-Architected Sustainability Pillars – sustainability guidance issued by major cloud providers (AWS, Azure, Google Cloud) as an extension of their existing architecture frameworks, covering region selection, right-sizing, and workload scheduling.
How These Standards Fit Into Engineering Practice
None of these frameworks replace engineering judgment, they give it a shared reference point. SCI provides the metric, the GHG Protocol places that metric within enterprise-wide reporting, and cloud provider sustainability pillars translate it into concrete infrastructure decisions. For enterprise teams building carbon-aware systems, adopting SCI as the working metric is typically the first step, since it’s the one designed specifically to measure software rather than an organization as a whole.
How to Implement Green Software Development
Knowing the principles and measurement frameworks is only the starting point. Implementation is where green software development moves from a sustainability goal to an actual engineering practice.
For most enterprises, the process works best as a phased approach rather than a complete overhaul. Teams first establish a baseline, identify the biggest sources of energy and carbon waste, make targeted improvements, and then embed carbon metrics into ongoing engineering decisions.
A Practical Framework for Implementing Green Software Development
1. Establish a Carbon Baseline
Start by understanding where the system currently consumes energy and generates emissions. Measure workloads, infrastructure utilization, cloud regions, and major compute-intensive processes using an SCI-aligned functional unit.
The goal isn’t perfect precision from day one. It is creating a baseline that lets teams identify trends and measure whether engineering changes are actually improving carbon efficiency.
2. Identify High-Impact Workloads
Not every part of an application deserves the same optimization effort. Focus first on workloads that consume the most compute or operate at the highest scale, such as:
- High-traffic APIs and services
- AI training and inference workloads
- Large-scale data processing pipelines
- Always-on infrastructure
- Storage-heavy applications
- CI/CD pipelines with frequent builds and tests
Optimizing a function that runs millions of times a day will usually deliver more impact than redesigning a low-traffic service.
3. Optimize Code and Architecture
Once high-impact workloads are identified, teams can reduce unnecessary computation through more efficient algorithms, caching, optimized database queries, smaller payloads, and better resource management.
At the architecture level, this may also involve adopting autoscaling, serverless computing, containerization, or independently scalable services where they make sense for the workload.
4. Make Infrastructure Carbon-Aware
Infrastructure decisions determine whether application-level efficiency translates into real-world carbon reductions. Teams should right-size cloud resources, eliminate idle capacity, choose appropriate deployment regions, and schedule flexible workloads around lower-carbon periods where possible.
For mature implementations, real-time carbon-intensity signals can also inform workload scheduling and routing decisions.
5. Integrate Carbon Into the Development Lifecycle
Green software development becomes sustainable only when it is part of normal engineering processes. Carbon and energy metrics should gradually be incorporated into:
- Architecture reviews
- Code reviews
- CI/CD pipelines
- Infrastructure planning
- Release decisions
- Production monitoring
This shifts sustainability from a one-time optimization project to a continuous engineering discipline.
6. Monitor, Improve, and Repeat
Implementation does not end after the first optimization cycle. Application usage, infrastructure, cloud regions, and energy grids constantly change.
Teams should continuously compare new measurements against their baseline, identify regressions, and prioritize improvements alongside traditional metrics such as performance, reliability, and cost.
Implementation Roadmap
Measure → Identify → Optimize → Deploy → Monitor → Improve
This phased approach gives organizations a practical path to green software development without requiring them to rebuild every existing system. The goal is to make carbon efficiency an increasingly visible engineering constraint, starting with the highest-impact workloads and expanding the practice across the software lifecycle.
What Are The Best Practices of Green Software Development?
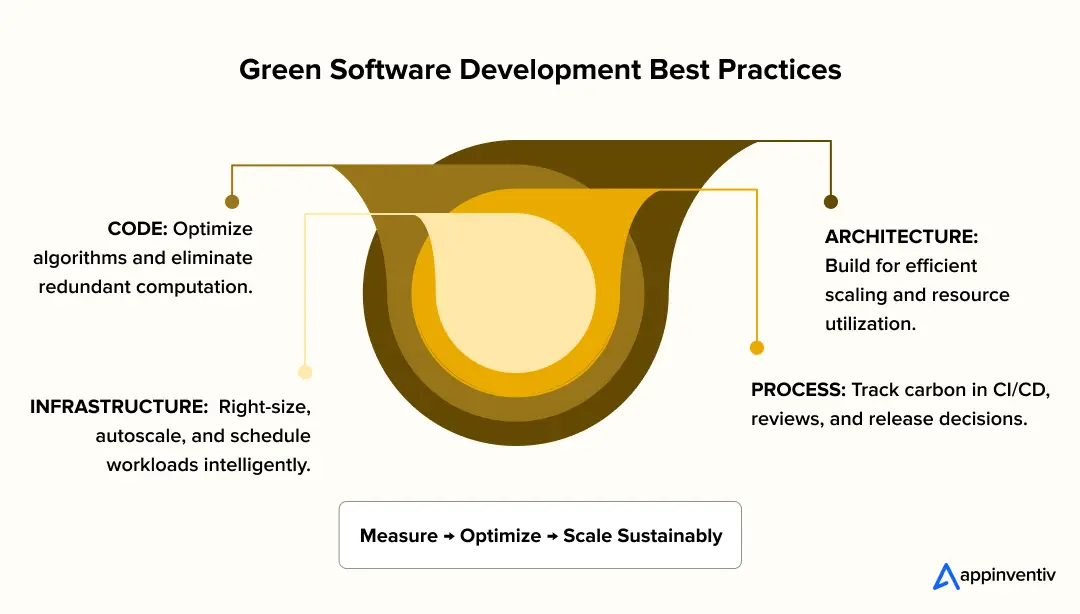
Turning green software engineering principles into practice, and following actual green software development best practices, means embedding carbon-awareness into the standard engineering workflow, not treating it as a separate audit.
This is also where teams looking to develop green software from the ground up should start. The best practices below map to specific points in the software development lifecycle.
Code-Level Optimization
Efficient code is the cheapest carbon reduction available, since it requires no infrastructure change, only better engineering discipline:
- Choose lower-complexity algorithms wherever the data scale justifies it, since energy consumption tracks computational complexity closely.
- Eliminate redundant computation through caching, memoization, and avoiding repeated database round trips for unchanged data.
- Minimize payload size by compressing assets, using efficient serialization formats, and trimming unused dependencies from the build.
- Profile before optimizing so effort goes toward the functions and queries actually consuming the most compute, not assumed bottlenecks.
Carbon-Aware Architecture
Architectural decisions made early in a project tend to lock in most of its long-term carbon cost, which makes this the highest-leverage stage to apply green principles:
- Serverless architecture and Function-as-a-Service (FaaS) architectures scale compute to zero when idle, avoiding the always-on energy draw of fixed servers, and they’re well suited to sporadic or event-driven workloads.
- Microservice architecture with independent scaling let high-demand components scale up without dragging the entire application’s infrastructure along with them.
- Edge computing moves processing closer to the user, cutting the network transfer emissions tied to routing every request through a centralized data center.
- Multi-region carbon-aware routing directs workloads to cloud regions running on cleaner grids, using tools like the Green Software Foundation’s Carbon Aware SDK to make that decision programmatically.
Infrastructure and Deployment Practices
Once code and architecture are optimized, infrastructure choices determine how much of that efficiency translates into real-world impact:
- Right-size cloud instances to actual usage patterns instead of provisioning for theoretical peak load.
- Set autoscaling policies aggressively enough that idle capacity doesn’t sit running between traffic spikes.
- Schedule non-urgent batch jobs (nightly reports, model retraining, large ETL runs) for windows when the regional grid’s carbon intensity is lower.
- Choose cloud regions and providers with published renewable energy commitments and transparent carbon reporting.
Development Process and Team Practices
Sustainable code doesn’t happen by accident, it requires the same process rigor teams already apply to security or performance:
- Add carbon metrics to CI/CD pipelines, flagging significant increases in compute cost the same way a pipeline would flag a failed test.
- Set a carbon budget per feature or release, similar to a performance budget, so emissions are a design constraint from the start rather than a retrofit.
- Conduct carbon-focused code reviews for high-traffic services, where small inefficiencies get multiplied across millions of executions.
- Default to green hosting providers for new projects, treating carbon intensity as a standard vendor evaluation criterion alongside cost and SLAs.
Why Best Practices Have to Span the Full Lifecycle
None of these practices deliver much impact applied in isolation. Optimized code deployed on an over-provisioned, always-on server barely moves the needle, and carbon-aware infrastructure running inefficient code still wastes cycles. The organizations seeing measurable reductions are the ones applying these practices consistently, from the first architecture decision through ongoing production monitoring.
Demand Shaping and Carbon-Aware Development
Most sustainability techniques in software change when work runs. Demand shaping is the one technique that changes what the software actually does, and it’s worth separating clearly from the pattern it’s most often confused with.
Demand Shifting vs. Demand Shaping
Demand shifting reschedules the same job to a lower-carbon window or a cleaner region, the work itself stays identical. Demand shaping alters the service in real time, in response to how carbon-intensive the grid is at that exact moment, which makes it a genuinely different engineering problem: the application has to be built with more than one way of delivering value.
A working example makes the distinction concrete. A video platform pulling a live carbon-intensity feed from an API like Electricity Maps or WattTime can drop its default streaming resolution when the grid is running dirty, and restore full quality once it’s running clean, all without the user noticing a service interruption. An AI inference pipeline can do the same thing by routing to a smaller, lighter model variant during high-carbon windows, trading a marginal accuracy loss for a real compute reduction. Neither example delays the work. Both reshape it.
Where Demand Shaping Shows Up in Practice
This pattern shows up wherever a service has some flexibility in how much it delivers without breaking the user experience:
| Workload type | Shaping response during high-carbon periods |
|---|---|
| Video/streaming | Lower default resolution or bitrate |
| AI/ML inference | Route to a smaller model variant |
| Batch/analytics | Run lighter aggregation instead of full recompute |
| Background tasks | Pause or defer non-urgent jobs entirely |
Implementing this well is less about the shaping logic itself and more about what has to exist before it: a carbon-intensity signal wired into the infrastructure or application layer, a reduced-service mode that’s treated as a designed, tested state rather than a degraded fallback, and thresholds for switching between modes that product and design have actually agreed to, not ones engineering sets alone.
Because of that dependency, demand shaping tends to be the last principle enterprise teams adopt, once energy efficiency and hardware efficiency are already in place. It’s also the clearest sign that a system is genuinely carbon-aware, rather than just carbon-measured: the application is responding to the grid it runs on, not just reporting on it.
Demand shaping only works if it’s designed from day one. We build that flexibility into the architecture from the start.

Tools Used to Measure Software Carbon Emissions
Most content on the green software measurement model stops at listing dashboards. The more useful distinction for engineering teams is how each tool actually derives its numbers, because the methodology determines how much you can trust the output, and where the blind spots are.
Hardware-Level Measurement: The Most Accurate, Least Used Layer
The most precise carbon data doesn’t come from a dashboard at all, it comes from reading power directly off the chip:
- RAPL (Running Average Power Limit), an Intel CPU interface, exposes real-time energy consumption per core and per socket, in joules, at the hardware register level.
- NVML (NVIDIA Management Library) provides the equivalent for GPUs, which matters significantly more for AI workloads than CPU-based estimates, since GPU draw dominates inference and training energy cost.
- Scaphandre and PowerAPI are open-source agents that read RAPL/NVML counters and attribute power draw down to the individual process, not just the host, which is the level of granularity needed to actually identify which service or function is the carbon offender.
This layer is rarely mentioned in generic guides because it requires bare-metal or VM-level access; most enterprise workloads run on managed cloud infrastructure where this data isn’t exposed to the tenant at all. That gap is exactly why the next layer exists.
Proxy-Based Estimation: What Most Cloud Tools Actually Use
Because direct hardware access is unavailable in shared cloud environments, tools like CodeCarbon and Cloud Carbon Footprint don’t measure emissions, they estimate them using published coefficient models.
Cloud Carbon Footprint, for instance, is built on the Cloud Carbon Coefficients research (originally from Etsy and Teads), which maps AWS/Azure/GCP instance types and utilization percentages to estimated wattage, then applies regional grid intensity to convert that to CO2e. This is a meaningful nuance to flag to clients: these numbers are modeled approximations, not metered readings, and can vary meaningfully between tools depending on which coefficient dataset they use.
The Marginal vs. Average Intensity Distinction
This is the technical detail most guides skip entirely, and it materially changes how carbon-aware scheduling should be implemented:
- Average grid intensity (what most dashboards, including cloud-native ones, report) is the total carbon output of a grid divided by total electricity generated over a period.
- Marginal emissions, which WattTime specializes in, measure the emissions impact of the next megawatt drawn from the grid, i.e., which power plant actually ramps up to meet your specific new demand.
For a demand-shifting or demand-shaping system, marginal data is the correct signal to build against. Average intensity can be deceptively low in a region with strong renewable capacity, while the marginal source, the plant that actually responds to a spike in demand, is frequently a fast-ramping gas peaker plant.
Optimizing against average intensity in that scenario can mean scheduling workloads at exactly the wrong time.
Container and Kubernetes-Level Attribution
For enterprises weighing serverless vs. microservices for containerized architectures (increasingly the default), pod-level attribution is where measurement gets genuinely difficult, and where a newer class of tooling has emerged:
- Kepler (Kubernetes Efficient Power Level Exporter), a CNCF sandbox project, uses eBPF to attribute RAPL-level power readings down to individual Kubernetes pods and containers, exporting the data as Prometheus metrics.
- This closes a real gap: cloud-native carbon dashboards report emissions at the instance or account level, but a single Kubernetes node often runs dozens of unrelated workloads. Without pod-level attribution, teams can see that a node is carbon-heavy without ever identifying which service is responsible.
Where Scope 2 Accounting Method Changes the Number Itself
Cloud provider carbon dashboards (AWS, Google Cloud, Microsoft Sustainability Manager) can report meaningfully different figures for identical usage, and the reason is often the underlying accounting method, not the workload:
- Location-based accounting uses the average carbon intensity of the physical grid a data center sits on.
- Market-based accounting factors in the provider’s renewable energy purchases and power purchase agreements (PPAs), which can make a data center in a coal-heavy grid region report near-zero emissions on paper.
Google Cloud’s dashboard defaults to market-based reporting; AWS’s Customer Carbon Footprint Tool historically leaned location-based for its “gross” figures. Neither is wrong, they answer different questions, but comparing numbers across providers without knowing which method each uses produces a false apples-to-apples comparison.
The Role of AI in Green Software Development
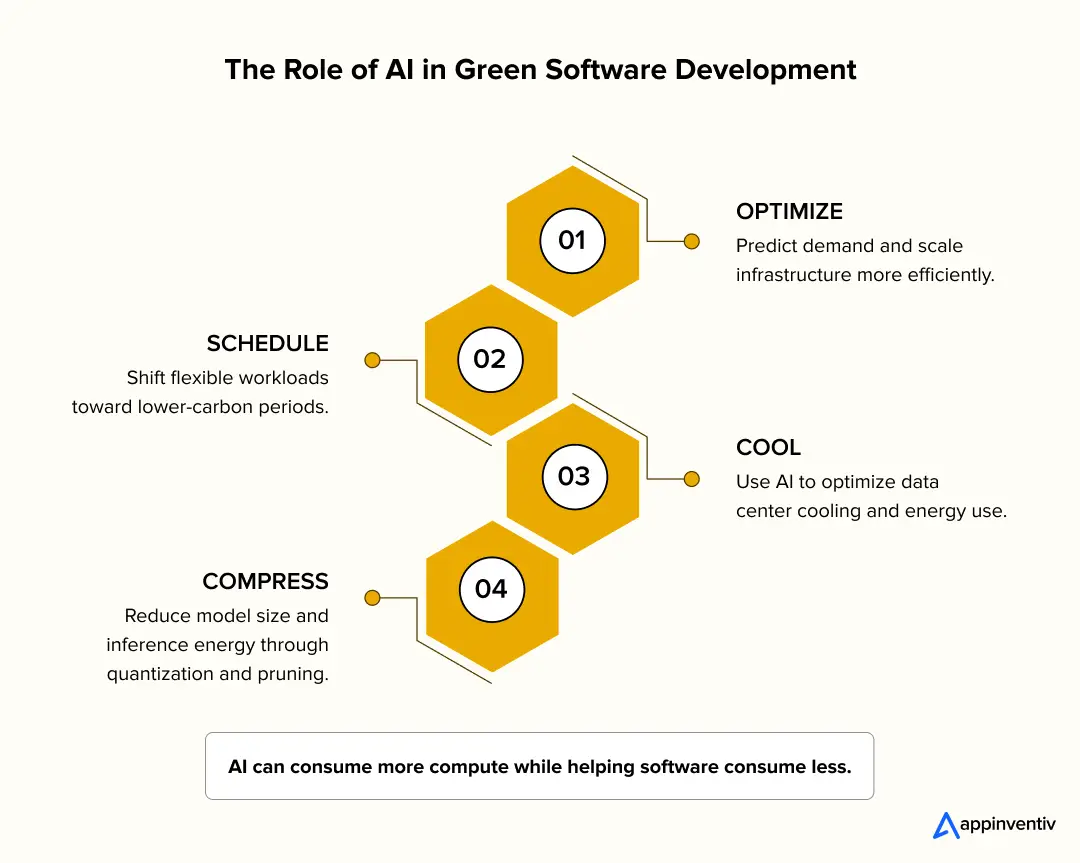
AI’s relationship with green software engineering runs in two directions at once, a theme covered in more depth in our piece on green AI applications, it’s simultaneously the biggest new source of compute demand and one of the more effective tools for reducing it elsewhere. Most content treats these as separate stories. They’re the same story.
Why AI Workloads Carry a Different Carbon Profile Than Traditional Software
Training and inference don’t behave like conventional application workloads, and treating them with the same optimization playbook misses where the actual cost sits:
- Training is a one-time, front-loaded cost. A large model’s training run can consume the energy equivalent of hundreds of households for a year, concentrated into days or weeks of continuous, near-100%-utilization GPU load, a very different power draw pattern than the bursty, variable load of a typical web application.
- Inference is the long-tail cost. Once deployed, a model’s cumulative inference emissions over its lifetime frequently exceed its training footprint, because inference runs continuously, at scale, for as long as the model stays in production. This is the number enterprise teams underestimate most often, they measure the training run and stop looking.
- GPU utilization, not just count, determines the footprint. Two teams running identical GPU fleets can have wildly different carbon profiles depending on batch size, model parallelism efficiency, and whether GPUs sit idle between requests; idle high-end GPUs still draw substantial baseline power.
Where AI Reduces Software’s Carbon Footprint
The more overlooked half of this relationship, explored further in our guide to AI in sustainability, is AI acting as the optimization layer for everything else:
- Predictive autoscaling uses ML models to forecast traffic patterns and pre-scale infrastructure precisely, avoiding both the over-provisioning of static capacity and the latency penalty of reactive scaling.
- Carbon-aware workload scheduling engines, increasingly built on reinforcement learning, learn a data center’s demand patterns and grid carbon signals well enough to shift flexible jobs automatically, beyond what static rule-based scheduling can achieve.
- AI-driven cooling optimization is one of the clearest green software engineering examples: Google DeepMind’s system for its own data centers used ML to adjust cooling parameters in real time, delivering measurable reductions in cooling energy, cooling typically accounts for a significant share of total data center power draw.
- Model compression techniques, quantization, pruning, and knowledge distillation, reduce a model’s compute footprint per inference, often with minimal accuracy loss, making them directly applicable to the demand shaping patterns covered earlier.
The Efficiency Curve Working in Parallel
There’s a technical nuance worth flagging that generic content usually misses: power consumption per AI task has been falling faster than most people assume, driven by hardware advances (more efficient accelerator chips) and software advances (better model architectures, sparsity techniques) compounding together.
This doesn’t offset the growth in AI adoption, aggregate demand is still rising, but it means the “AI is inherently carbon-hostile” framing is incomplete. The more accurate framing is that AI’s footprint is a function of how it’s deployed, not an unavoidable property of the technology.
What This Means for Engineering Teams Building AI Features
For teams adding AI capabilities to existing products, the practical decisions that matter most are model selection (using the smallest model that meets the accuracy bar, rather than defaulting to the largest available), batching strategy (grouping inference requests to improve GPU utilization instead of processing them one at a time), and deployment architecture (choosing between always-on inference endpoints versus serverless, carbon-aware routing based on actual traffic patterns).
These decisions typically have more impact on an AI feature’s carbon footprint than the choice of underlying model architecture itself.
Challenges of Green Software Development
Green software engineering runs into real friction in practice, and most of it comes down to measurement gaps, competing priorities, and legacy constraints rather than a lack of engineering will.
Limited Visibility Into Actual Emissions
Challenge: Most teams don’t have direct access to hardware-level power data, especially on managed cloud infrastructure, which forces reliance on modeled estimates rather than metered readings, and different tools can report meaningfully different numbers for the same workload.
Solution: Layer measurement instead of trusting a single source. Use cloud-native dashboards for a baseline, cross-check against an independent estimator like Cloud Carbon Footprint, and adopt pod-level tools like Kepler where infrastructure access allows it. Treat the resulting number as directionally useful for tracking trends, not as a precise absolute figure.
Carbon Optimization Competing With Performance Priorities
Challenge: Carbon-aware decisions sometimes conflict with latency or availability targets, always-on infrastructure is more carbon-intensive than scale-to-zero serverless, but it’s also more responsive, and demand shaping by definition means occasionally delivering a reduced-quality experience.
Solution: Set explicit thresholds upfront, agreed with the product, for where carbon savings are worth a performance trade-off and where they aren’t. Non-critical background jobs are usually safe to shape aggressively; user-facing latency-sensitive paths generally aren’t.
Legacy Systems and Technical Debt
Challenge: Older codebases and monolithic architectures weren’t designed with energy efficiency or dynamic scaling in mind, and rewriting them purely for carbon reasons is rarely a business case that gets funded on its own.
Solution: Bundle carbon optimization into work that’s already planned, a migration, a refactor, a cloud provider switch, rather than proposing standalone sustainability projects. Efficiency gains ride along with modernization efforts that are already justified on other grounds.
Lack of Standardized Tooling Across Cloud Providers
Challenge: AWS, Azure, and Google Cloud each report emissions differently (location-based versus market-based accounting, different coefficient models), which makes multi-cloud environments genuinely difficult to benchmark consistently.
Solution: Standardize internally on one framework, typically SCI, as the reporting layer regardless of provider, a discipline that overlaps closely with a sound multicloud strategy, and treat each cloud’s native dashboard as a data input rather than the final metric. This keeps comparisons consistent even when the underlying providers aren’t.
Organizational Ownership Gaps
Challenge: Carbon efficiency often falls into a gap between engineering, which controls the technical levers, and sustainability teams, which own the reporting, and neither side typically has full context on the other’s constraints.
Solution: Assign carbon metrics to engineering leads as a tracked KPI, the same way performance or uptime is tracked, with sustainability teams consuming that data rather than generating it independently. This keeps the metric close to the people who can actually act on it.
Green Software Development Trends 2026
A few shifts are shaping the future of green software development, moving sustainable software engineering from a niche practice to a standard part of enterprise engineering roadmaps this year.
Carbon Metrics Entering Standard Observability Stacks
Carbon and energy data are increasingly showing up alongside latency and error rates in mainstream APM and observability platforms, rather than living in a separate sustainability report pulled quarterly. This shift matters because it puts carbon in front of the engineers who can actually act on it, in the same dashboard they already check daily.
AI-Specific Carbon Accounting Maturing
As inference costs increasingly exceed training costs in cumulative footprint, tooling is catching up to measure AI workloads specifically, tracking GPU utilization, batch efficiency, and per-inference energy rather than treating AI as a generic compute workload. Expect procurement conversations to start asking for per-inference carbon figures, not just training-run disclosures.
Regulatory Pressure Extending Into Software Procurement
With CSRD and SEC-style disclosure rules pushing Scope 3 accounting further down the supply chain, enterprises are starting to push carbon reporting requirements onto their software vendors, not just their own infrastructure. Being able to answer an SCI-based question in an RFP is becoming a practical requirement in some sectors, not a differentiator, sectors like green fintech are already setting the pace here.
Carbon-Aware Scheduling Becoming a Default Cloud Feature
Major cloud providers are moving carbon-aware region and scheduling recommendations from opt-in tools into default infrastructure guidance, lowering the technical bar for demand shifting. This makes carbon-aware deployment accessible to teams without dedicated sustainability engineering resources.
Model Efficiency Becoming a Competitive Metric
As the efficiency curve for AI computers continues improving faster than raw adoption grows, smaller, more efficient models are gaining ground as a deliberate choice, not just a cost-saving fallback. Expect more vendors to market model efficiency and inference carbon footprint as a selling point alongside accuracy benchmarks.
Together, these shifts point to a clear picture of the future of green software development: carbon as a standard, measured engineering input rather than an occasional initiative.
Carbon is becoming a standard engineering input, not an afterthought. Build your roadmap with a team already engineering for what’s next.
Ready to Build Carbon-Efficient Software That Performs
Reducing a system’s carbon footprint isn’t a separate initiative from good engineering, it’s what good engineering increasingly looks like: leaner code, right-sized infrastructure, and architecture decisions that hold up under both a performance review and a carbon audit.
Appinventiv has designed and delivered 3,000+ solutions, transformed 500+ legacy processes, and built 5+ strategic federal partnerships. Experienced enterprise teams draw on when they need to hire software developers who can develop green software at production scale, not just prototype it.
Our background carries directly into how we approach green software development: carbon-aware architecture, efficient legacy modernization, and infrastructure decisions built to hold up at enterprise scale, not just in a proof of concept.
Whether that means designing a carbon-aware microservices architecture, optimizing an existing system’s compute footprint, or building AI features with inference efficiency in mind, our custom software development solutions are built around the same approach: measurable, SCI-aligned outcomes rather than a general sustainability statement.
Building software that performs and scales responsibly starts with the right team behind it. Talk to our software development team now.
FAQs
Q. How does software development contribute to carbon emissions?
A. Software generates emissions across three layers: compute (CPU/GPU cycles spent executing code), storage (power draw from holding data at rest), and network (energy spent transferring data between users and servers). Inefficient code compounds this at scale, an algorithm that runs ten times slower typically consumes roughly ten times the energy for the same output, repeated across every request.
Q. What is the Software Carbon Intensity (SCI) standard?
A. SCI is a Green Software Foundation standard, formalized as ISO/IEC 21031:2024, that measures carbon emissions as a rate rather than a total: SCI = ((E × I) + M) per R, where E is energy consumed, I is grid carbon intensity, M is embodied carbon from hardware, and R is a functional unit of work (per API call, per user, per transaction). This lets systems be benchmarked on carbon efficiency even as usage scales.
Q. What is demand shaping in green software development?
A. Demand shaping means adjusting a service’s behavior in real time based on grid carbon intensity, such as lowering video resolution or routing to a smaller AI model during high-carbon periods, rather than simply rescheduling the same work for later (which is demand shifting instead). It requires the application to be built with a designed, tested reduced-service mode from the start.
Q. What tools are used to measure software carbon emissions?
A. Measurement spans several layers: hardware-level tools like RAPL and NVML for direct power readings, proxy-based estimators like CodeCarbon and Cloud Carbon Footprint for cloud environments without hardware access, carbon-intensity data providers like Electricity Maps and WattTime, Kubernetes-native tools like Kepler for pod-level attribution, and cloud-native dashboards from AWS, Google Cloud, and Microsoft. No single tool covers the full picture, most enterprise setups combine at least two or three.
Q. What frameworks and standards guide green software engineering?
A. The core framework is SCI, alongside the GHG Protocol (which places software emissions within Scope 3 corporate reporting), the Green Software Foundation’s Patterns Catalog, and cloud providers’ own Well-Architected Sustainability Pillars. Together, these give engineering teams a shared, comparable reference point rather than one-off internal metrics.
Q. How does AI contribute to green software development?
A. AI cuts both ways: it’s a major new source of compute demand, especially through inference, which frequently exceeds a model’s training footprint over its lifetime, but it’s also an effective optimization tool elsewhere, powering predictive autoscaling, carbon-aware workload scheduling, and AI-driven cooling optimization in data centers. The net impact depends heavily on how AI features are deployed, not the technology itself.
Q. What is the role of serverless architecture in green software engineering?
A. Serverless and Function-as-a-Service (FaaS) architectures scale compute to zero when idle, avoiding the constant energy draw of fixed, always-on servers. This makes them well suited to sporadic or event-driven workloads, though the trade-off is less responsiveness compared to always-on infrastructure, which is why the choice usually comes down to a workload’s actual traffic pattern rather than a blanket rule.


Fast 2-minute response, fully NDA-protected.

Beyond Customer Portal Development: Building Connected Digital Services
Key takeaways: A portal without CRM, ERP and billing integration leaves your staff doing the connecting. Start with customer tasks, then integrate only the systems those tasks actually need. Name one system of record for each data type before choosing APIs or middleware. Plan integration, security and privacy obligations at the start, not after the…

CRM Software for Local Government: From Community Requests to Better Service Delivery
Key takeaways: A council CRM should sit around existing systems as a service layer, not replace them. Integration with ERP, rates, property and GIS systems prevents another data silo and duplicate entry. Start with one high-volume service, pilot it with residents, then scale on measured results. Track resolution time, SLA compliance, self-service rates and cost…

The Ultimate Guide to CRM for Insurance: Features, Cost, Top Platforms, Integration & More
Key takeaways: CRM for insurance connects sales, service, and claims into one governed system, distinct from the policy administration system. Core features span pipeline management, policy visibility, claims tracking, commission management, AI analytics, and compliance controls. Cost ranges from roughly USD 15,000 for configuration to USD 150,000 and beyond for custom development at enterprise scale.…