- How Mobile App Downloads and Usage Stats Help Businesses Optimize Strategies
- Retention & Re-Engagement
- Identifying Strengths & Weaknesses
- Competitive Benchmarking
- Data-Driven Product Development
- 30 Must-Know Mobile App Download and Usage Stats Shaping 2025 and Beyond
- The Explosion of Mobile App Downloads: A Booming Digital Economy
- Key Insights on Mobile App Statistics:
- Platform Distribution: Android vs. iOS Market Share
- Key Insights:
- Mobile App Usage Patterns: How Users Interact with Apps
- Key Mobile App Usage Statistics & Insights:
- Daily Engagement: How Often Users Interact with Apps
- Key Insights on Daily App Engagement:
- App Retention Rates: Understanding User Engagement and Loyalty
- Key Insights on App Retention:
- User Demographics and Behavior: Who’s Using Mobile Apps and How?
- Key Insights on User Demographics and Behavior:
- Geographical Variations: How Mobile App Usage Statistics Differs Across Regions
- Popular App Categories and Their Growth: Trends Shaping the Mobile Landscape
- Key insights on popular app categories:
- Revenue Tactics That Fuel Mobile App Download Growth
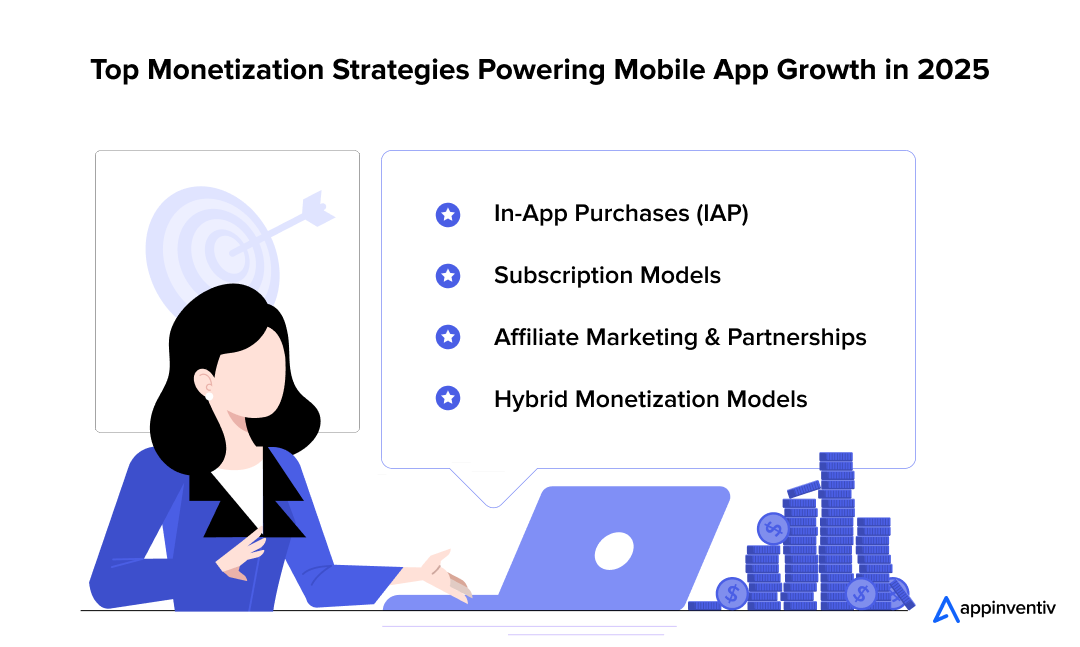
- In-App Purchases (IAP)
- Subscription Models
- Affiliate Marketing & Partnerships
- Hybrid Monetization Models
- Mastering User Retention: Key Challenges and Proven Solutions
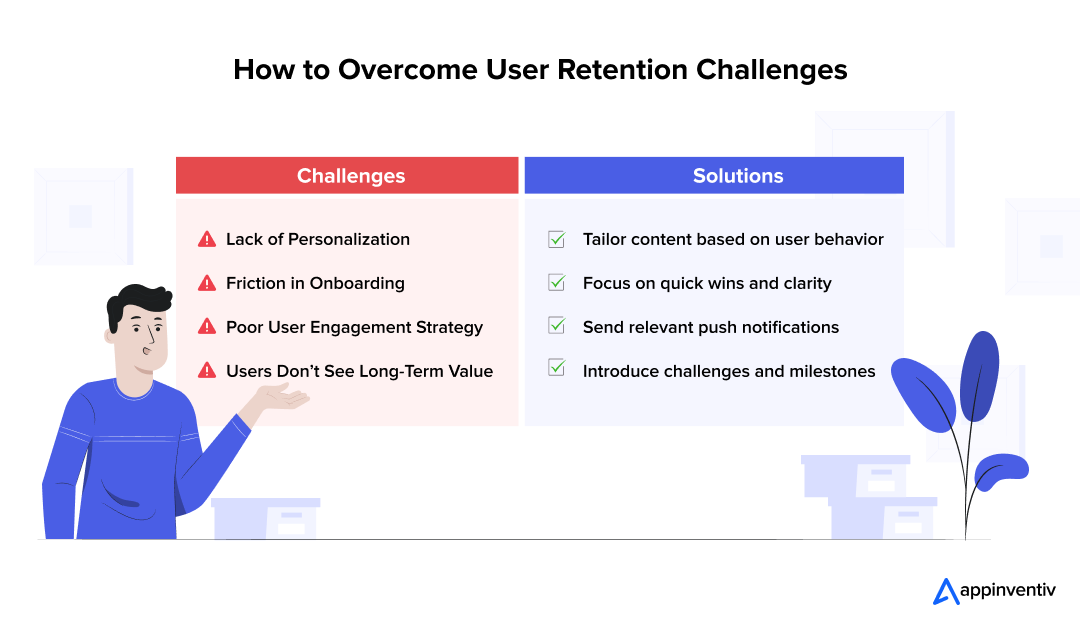
- Lack of Personalization
- Friction in Onboarding
- Poor User Engagement Strategy
- Users Don’t See Long-Term Value
- Mobile App Market Trends 2025 and Beyond: What’s Shaping the Next Generation of Apps
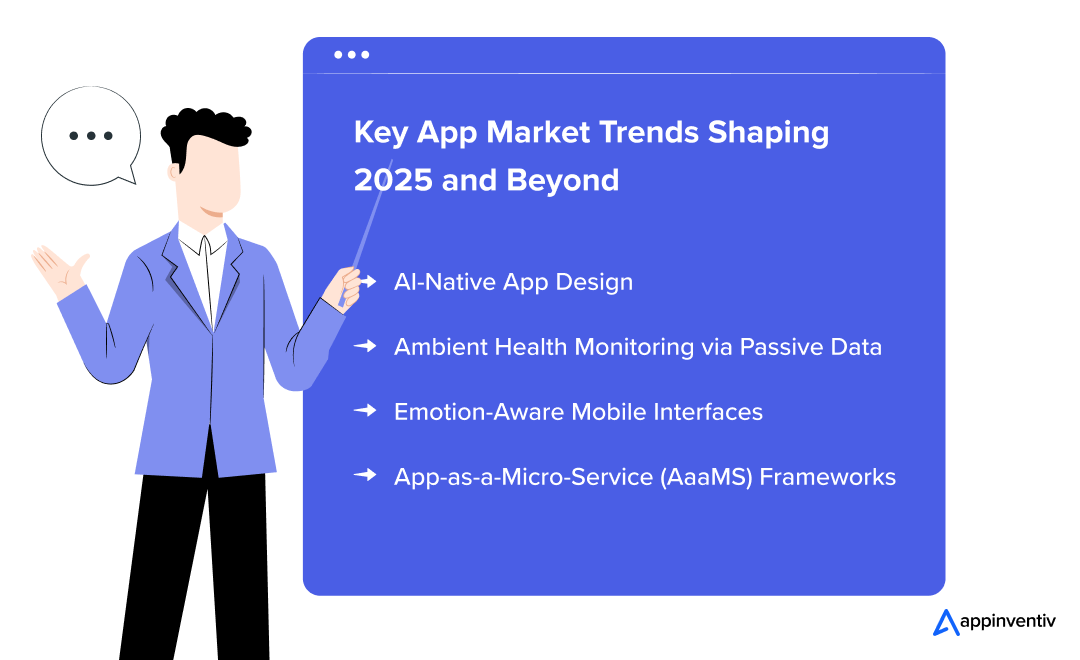
- AI-Native App Design
- Ambient Health Monitoring via Passive Data
- Emotion-Aware Mobile Interfaces
- App-as-a-Micro-Service (AaaMS) Frameworks
- Optimize Your Digital Strategy with Appinventiv
- FAQs
With mobile shaping how we live, work, and shop, a strong app presence is no longer optional—it’s essential. With users spending over 4 hours daily on mobile apps, staying ahead of mobile trends is key to staying visible and competitive. According to the global mobile app market overview, the industry is on track to hit $2.2 trillion by 2030, proving that the mobile space isn’t just growing; it’s exploding. (Source: Sensor Tower)
But building a killer app is only part of the equation. The real magic is understanding what happens after someone downloads it. Is your app reaching the home screen or heading straight to the trash bin? Are users hooked, or ghosting you after day one? Are you optimizing for retention, or just watching the churn?
The answers to all these questions lie in how you study, understand, and deploy mobile app download and usage data. Tracking this data sheds light on user behavior and provides a roadmap for refining your app’s performance and driving long-term success.
In this blog, we’ve rounded up 30+ essential mobile app download and usage statistics to help you decode real user behavior and craft a smarter, data-driven digital strategy. Whether you’re optimizing an existing product or prepping your next launch, these insights are your secret weapon.
Let’s examine the numbers driving the mobile experience in 2025 and what they mean for your business.
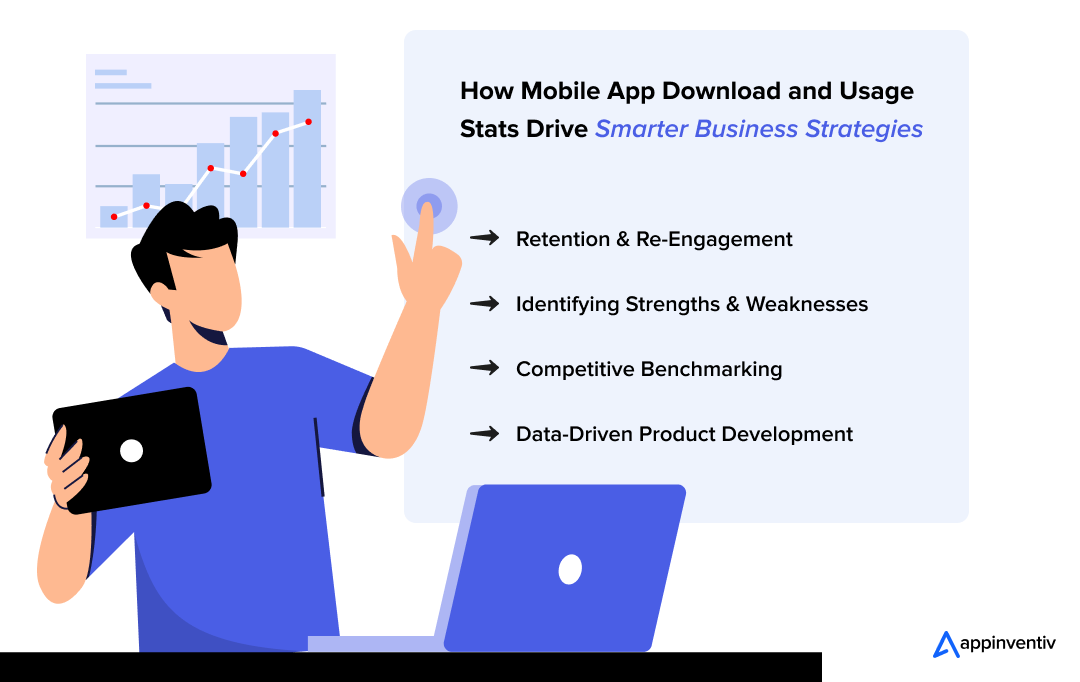
How Mobile App Downloads and Usage Stats Help Businesses Optimize Strategies
Mobile App Download Statistics: show how many times an app has been downloaded, highlighting its initial popularity and reach.
Mobile App Usage statistics: Reveal how users interact with the app after installation, uncovering patterns in engagement, retention, and overall performance.
Here’s how businesses can leverage these insights to their advantage:
Retention & Re-Engagement
Tracking churn patterns using mobile app statistics helps businesses develop effective strategies to engage users through personalized push notifications, rewards, and timely content updates. When companies understand when and why users drop off, they can take proactive steps to bring them back.
Example: If user activity drops after three days, introducing a well-timed incentive like a discount or reminder can effectively re-engage them.
At Appinventiv, our experts boosted Pizza Hut’s food delivery app conversion rate by 30% through a transformative UX/UI redesign. Our team focused on creating a visually engaging and user-friendly experience, prioritizing retention and re-engagement.
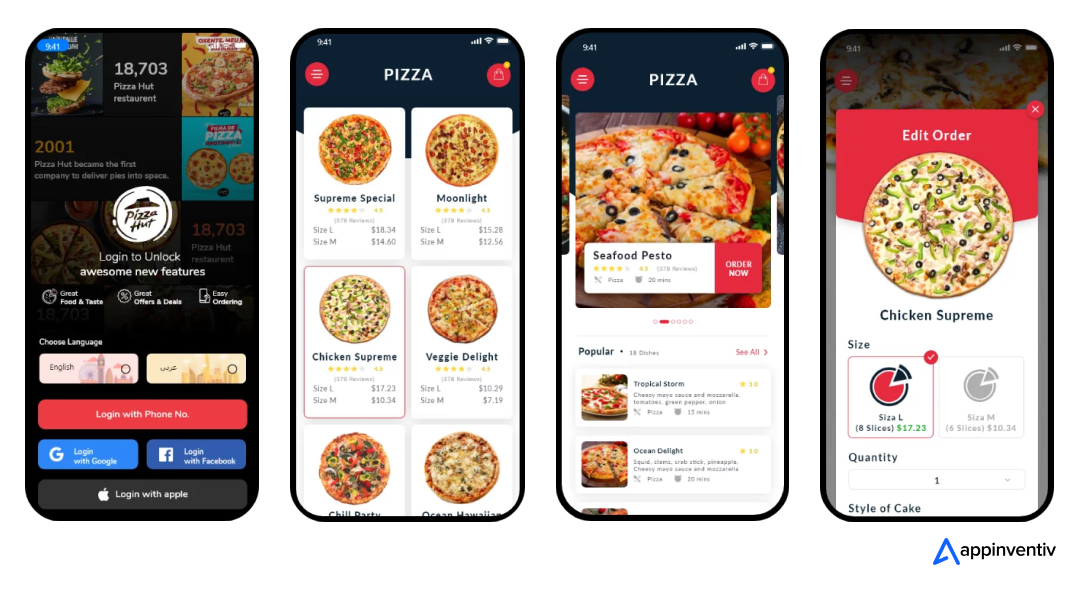
By conducting thorough research, we gained deep insights into user needs. This enabled us to drive Pizza Hut’s digital transformation with advanced technologies, ultimately enhancing customer satisfaction and loyalty.
Our in-depth research allowed us to understand user needs and leverage the best tools and technologies for Pizza Hut’s digital transformation. This led to over 50k app downloads, reduced screen transition times to 7 seconds, and a 30% boost in conversion rates.
Identifying Strengths & Weaknesses
High downloads don’t guarantee long-term success; what truly matters is how users interact with the app post-download. Professional app consulting and strategy ensure your application is designed with retention mechanisms and engagement triggers from day one. By leveraging enterprise mobile app statistics, businesses can analyze feature engagement and drop-off points to refine the UX and optimize the user journey.
Example: Enhancing onboarding with interactive tutorials can improve long-term engagement if retention rates drop significantly after the first week.
Competitive Benchmarking
Comparing app performance with industry benchmarks helps businesses identify competitive advantages and areas for improvement. Metrics like session duration and engagement frequency clearly show an app’s performance.
Example: Integrating gamification or better notification strategies can improve retention if competing apps have significantly higher daily open rates.
Data-Driven Product Development
Rather than relying on guesswork, businesses can use real-time insights to determine what features users find valuable and which need refinement. This approach leads to smarter product updates and a better overall experience.
Example: Improving the UX can enhance customer satisfaction and ratings if a widely used feature receives frequent negative feedback.
30 Must-Know Mobile App Download and Usage Stats Shaping 2025 and Beyond
As mobile technology continues to evolve, app downloads have skyrocketed. Billions of users worldwide rely on mobile applications for everything from entertainment and shopping to productivity and healthcare. Understanding global download trends is essential for businesses looking to optimize their digital strategy and reach the right audience effectively. Let’s have a look at those.
The Explosion of Mobile App Downloads: A Booming Digital Economy
Mobile apps have become essential in everyday life, from social networking and entertainment to shopping and productivity. Every tap on the “Install” button is a new opportunity for businesses to engage users in an increasingly competitive space.
The mobile app download statistics are driven by platform popularity (iOS vs. Android), app store optimization (ASO), and regional trends. With rising smartphone penetration and better internet access, downloads are hitting record highs year after year.
Key Insights on Mobile App Statistics:
1. App Downloads in 2025
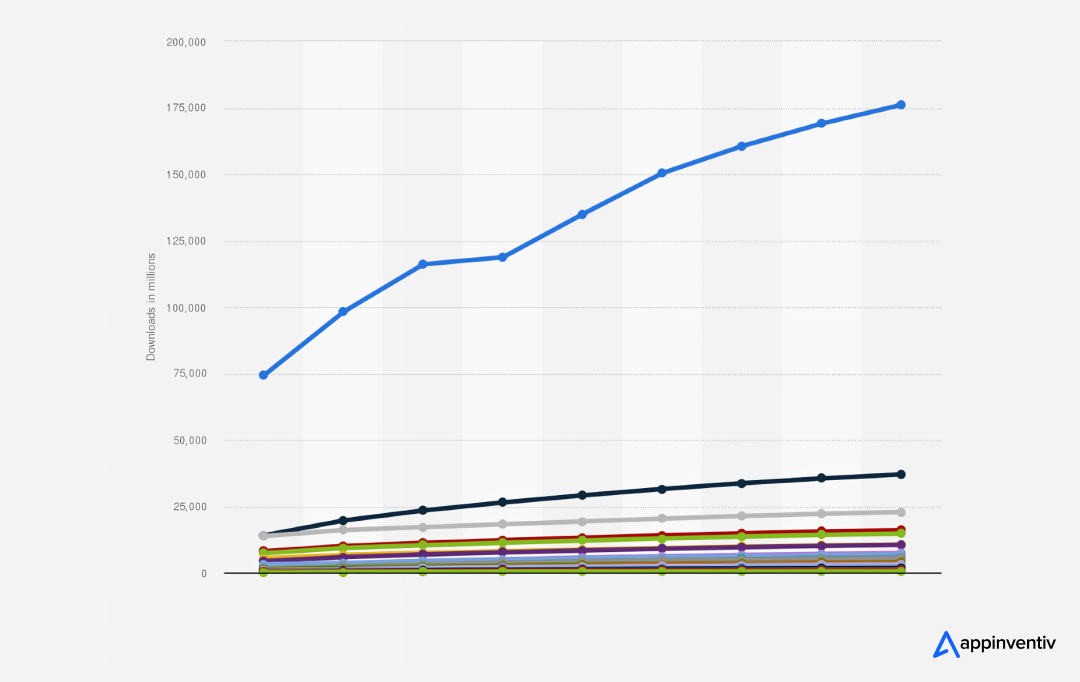
300+ billion app downloads are projected in 2025, continuing the upward trend. (Source: Statista). All segments are expected to see substantial growth in app downloads by 2027, reflecting the broader growth of mobile apps and continuing the steady upward trend observed from 2019 through the entire forecast period.
2. Apps Accounted in the Google Play Store
In 2024, the Google Play Store accounted for 102.4 billion app downloads, while the iOS App Store recorded 35.4 billion downloads. (Source: BusinessofApps)
3. Apps Attributed to Games & Other Types
Out of the total downloads, 46.9 billion were attributed to games, while 91.3 billion were for other types of apps. (Source: BusinessofApps)
4. Mobile App Markets in Major Regions
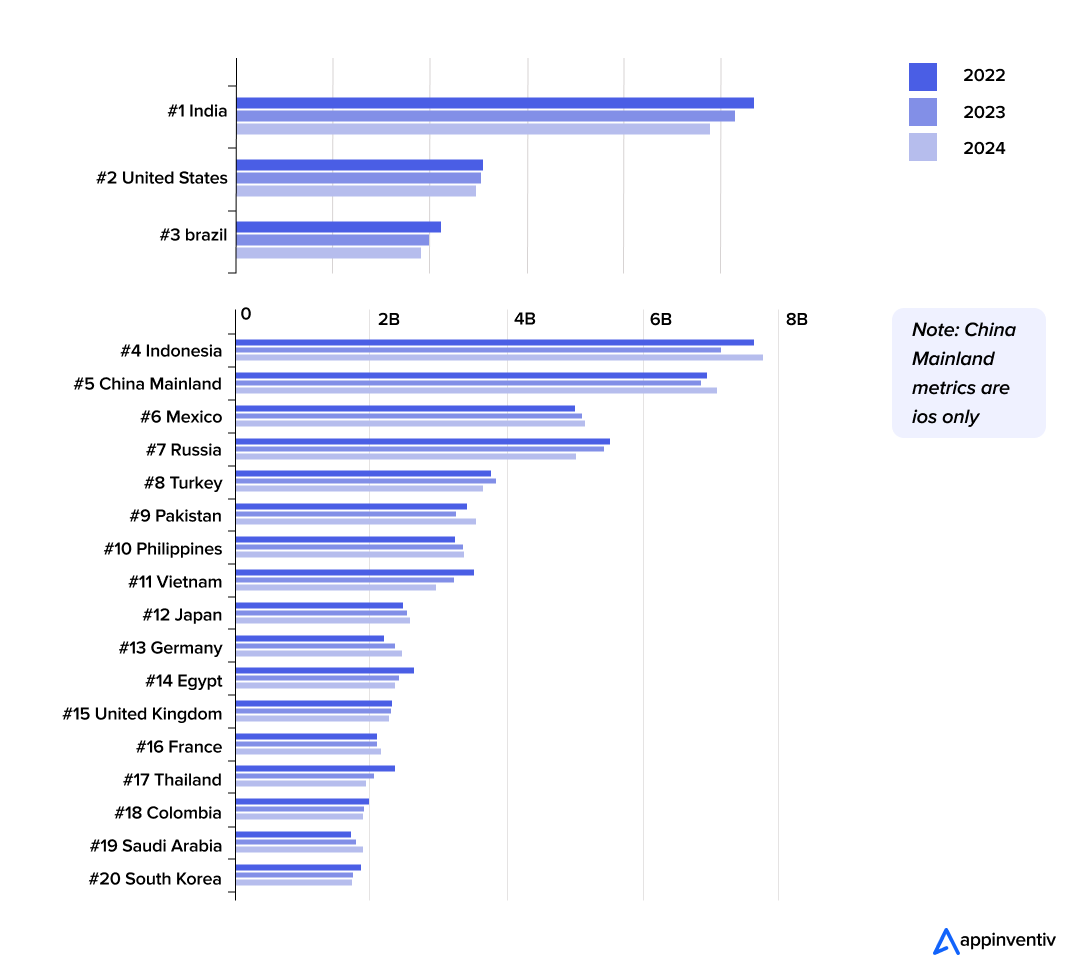
Emerging markets like India, Brazil, and Indonesia fuel rapid growth. India’s app download growth rate over the same period soared to an impressive 190%, significantly outpacing the United States, which recorded a modest 5% increase. (Source: Sensor Tower)
| Move: Launch on both iOS and Android—don’t wait. Outcome: Maximize visibility, tap into new acquisition channels, and accelerate growth. |
Platform Distribution: Android vs. iOS Market Share
The mobile app ecosystem is dominated by two giants—Android and iOS, each catering to distinct user behaviors and mobile app demographics. Understanding their download distribution helps businesses strategize their app launches effectively.
Key Insights:
5. Android App Users
Android leads the global market, accounting for over 70% of total app downloads due to its massive user base across different platforms. (Source: Statista)
6. iOS App Users
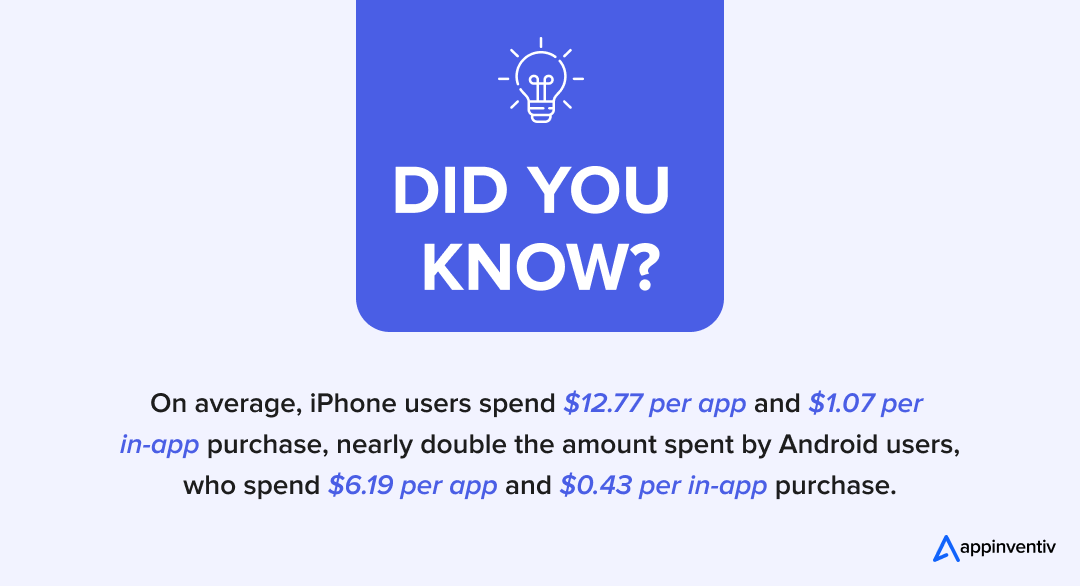
iOS dominates revenue generation, with Apple’s App Store contributing nearly 65% of total app revenue despite fewer downloads. (Source: TechCrunch)
7. Android Vs iOS Users
iOS is dominant, capturing approximately 57.68% of the market, while Android holds around 42.06%. (Source: Exploding Topics)
| Move: Optimize for both platforms to maximize reach and revenue potential. Outcome: A balanced strategy ensures global visibility, higher engagement, and diversified revenue streams. |
Mobile App Usage Patterns: How Users Interact with Apps
Downloading an app is just the beginning—what truly defines success is how often users engage with it. Analyzing mobile usage patterns helps businesses refine their strategies to boost retention, increase engagement, and maximize revenue.
Key Mobile App Usage Statistics & Insights:
8. Average Daily Spend of an Individual on Mobile
The average individual spends about 4 hours and 37 minutes on their phone daily, adding up to more than a full day each week, roughly 6 days per month, and nearly 70 days per year dedicated to screen time. (Source: Exploding Topics)
9. Time Spent within Apps
90% of mobile time is spent within apps, while only 10% is on web browsing. (Source: MobiLoud)
10. Users Retention
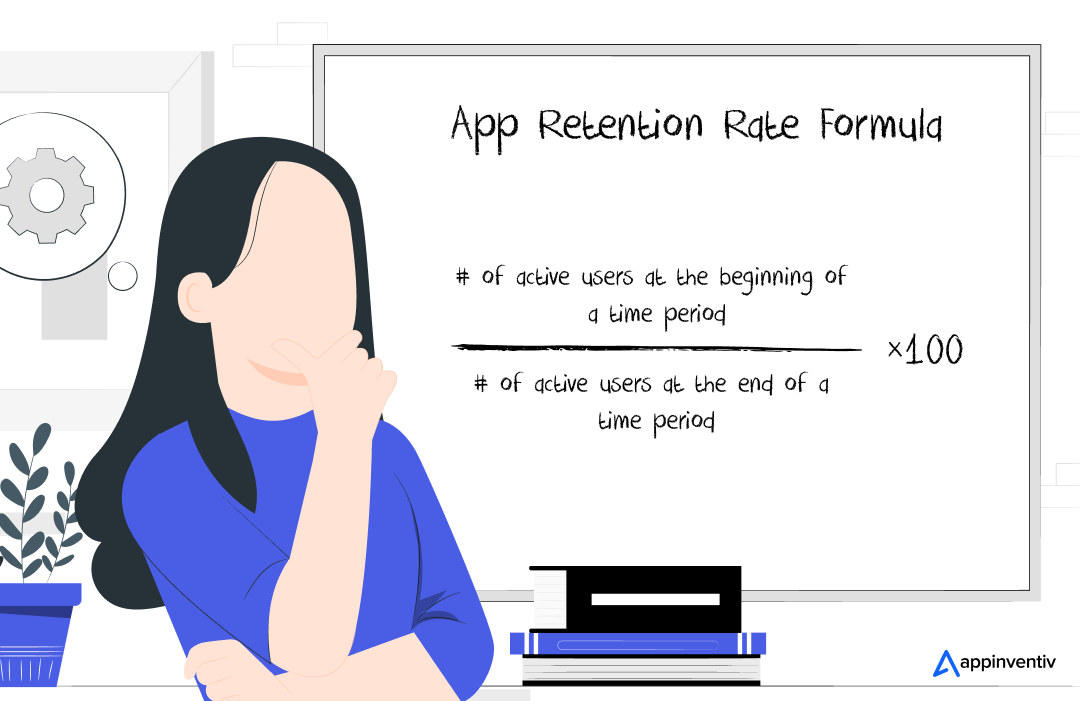
Retention is a challenge; only 25% of users return after day one, highlighting the need for strong early engagement. (Source: Adjust)
11. Games Categories in the Apple Store
Games represent the largest category on the Apple App Store, accounting for 11.86% of all available apps, followed by Business at 10.11%, Utilities at 9.73%, and Education at 9.56%. (Source: Design Rush)
| Move: Strengthen retention with smooth onboarding, personalized content, and timely push notifications. Outcome: Improved user engagement, increased app loyalty, and higher revenue potential. |
Daily Engagement: How Often Users Interact with Apps
A high download count means little if users aren’t engaging with your app. Daily engagement is a critical metric that reflects how often users interact with an app, influencing retention rates and long-term success. Apps seamlessly integrating into daily routines tend to achieve higher engagement and monetization potential.
Key Insights on Daily App Engagement:
12. Average Time Users Check Their Mobile
The average user checks their phone 58 times daily, with a significant portion of interactions happening inside apps. (Source: Exploding Topics)
13. Time Spent Daily on Social Networking Sites
Mobile users spend over 4.5 hours daily on apps, with social media, messaging, and video streaming apps driving the highest engagement. (Source: Exploding Topics)
14. Number of Apps People Engage With on Daily Basis
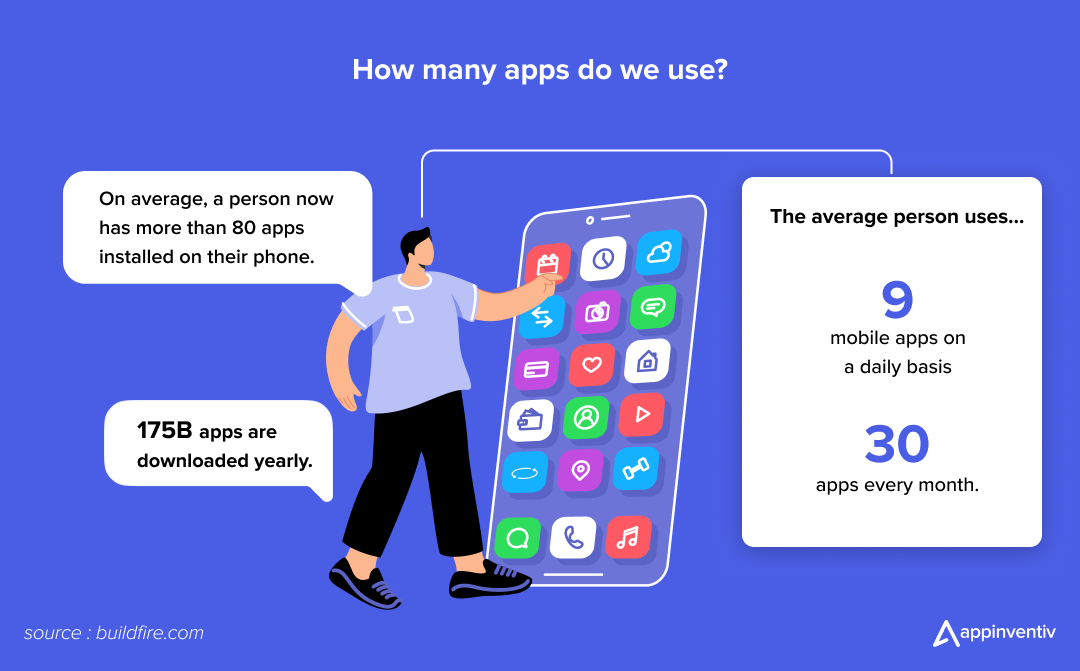
Users actively engage with about 9-10 apps per day, but only around 30 apps see regular use each month. (Source: BuildFire)
15. Game App Session Frequency
Gaming apps lead in session frequency, with users opening them multiple times daily, while finance and shopping apps see fewer but more intentional visits. (Source: Adjust)
16. Push Notification Engagement
Push notifications can boost engagement by up to 88%, but excessive notifications risk app abandonment. (Source: Airship)
| Move: Keep users engaged with personalized content, timely notifications, and interactive features like gamification and rewards. Outcome: Increased daily active users (DAU), improved retention rates, and stronger user loyalty, leading to better monetization. |
We partnered with Appinventiv to build a future-ready platform that seamlessly fits into our customers’ fast-paced lifestyles and boosts our competitive edge. The Appinventiv team understood our vision and enhanced it with their expertise. This led to significant improvements in user engagement and digital revenue. Ultimately, we saw a 22% increase in conversion rates and a 60% rise in repeat orders within the KFC mobile app.
App Retention Rates: Understanding User Engagement and Loyalty
Acquiring users is significant, but retaining them is crucial for an app’s long-term success. While the mobile app user growth rate highlights how quickly new users join the ecosystem, retention rates shed light on user engagement and satisfaction. They underscore the importance of delivering consistent value to maintain user interest. A high retention rate boosts revenue and strengthens brand credibility and user trust.
Key Insights on App Retention:
17. Users Return to an App the Day After Installation
Approximately 26% of users return to an app the day after installation, indicating that nearly three-quarters of users disengage within the first 24 hours. (Source: Adjust)
18. Mobile App Revenue of Companies
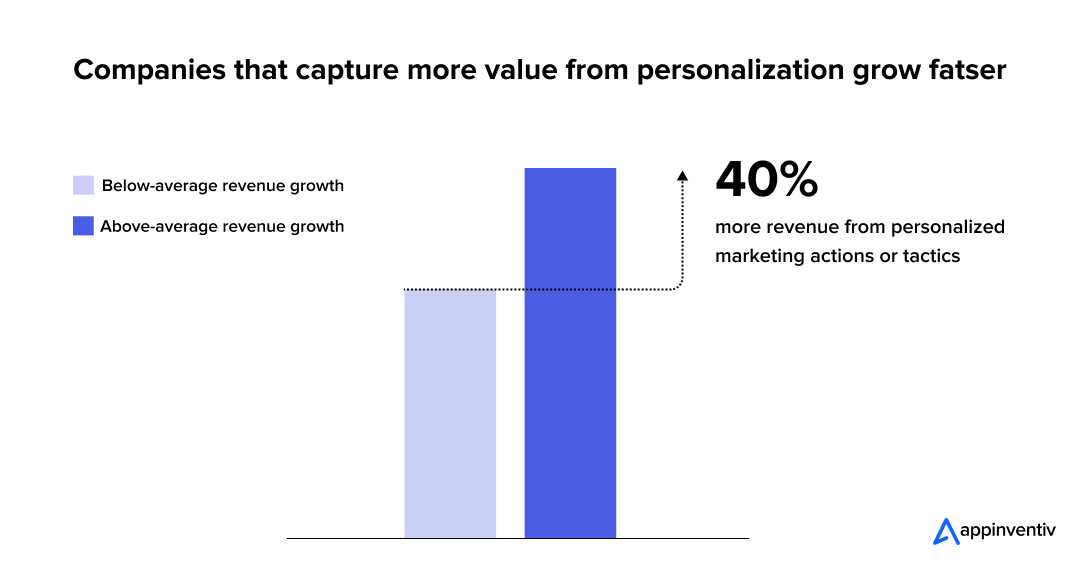
Mobile app revenue statistics reveal that companies excelling in personalization generate up to 40% more revenue than their competitors, highlighting the impact of tailored user experiences. (Source: McKinsey & Company)
19. Correlation in Customer Experience and Retention
There is a strong correlation between customer experience and retention, with overlap as high as 80 to 90 percent in some markets. (Source: McKinsey & Company)
Move:
Outcome: By focusing on these retention strategies, businesses can enhance user satisfaction, increase lifetime value, and achieve sustainable growth in the competitive app market. |
User Demographics and Behavior: Who’s Using Mobile Apps and How?
Mobile app usage isn’t one-size-fits-all—it varies across age groups, genders, and regions. Insights into mobile app usage by age help businesses refine their features, marketing strategies, and user experiences for maximum engagement. Companies can create personalized experiences that drive retention and in-app conversions by analyzing user behavior. A data-driven approach helps businesses stay ahead of evolving consumer preferences and industry trends.
Key Insights on User Demographics and Behavior:
20. Age Demographics in App Usage
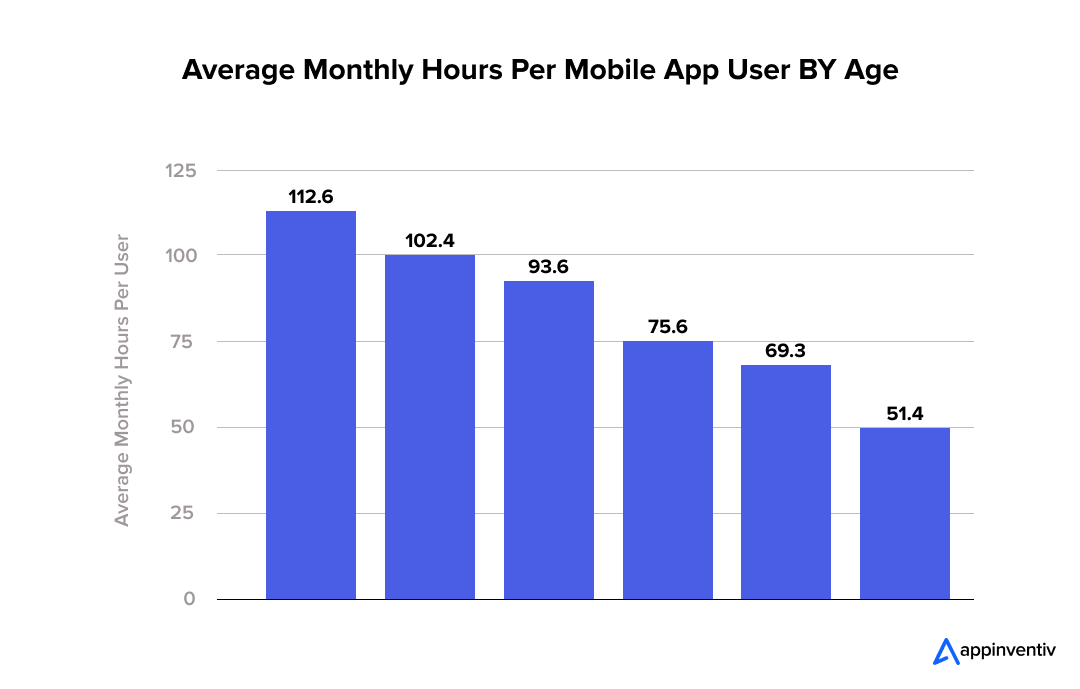
Teenagers and young adults lead in app usage, with 18–24-year-olds averaging 112.6 hours and 25–34-year-olds 102.4 hours monthly. Users over 35 spend under 100 hours, and those 65+ spend less than 51.4 hours monthly. (Source: BusinessofApps)
21. Gender Demographics in App Usage

Women lean towards social media, shopping, and wellness apps, whereas men favor gaming, finance, and productivity apps. (Source: Exploding Topics)
22. Generational Demographics in App Usage
62% of Generation Z and 61% of Millennials are likely to make in-app purchases, indicating a higher propensity than older generations. Notably, 17% of Gen Z users make daily in-app purchases. (Source: Adjust)
| Move: Leverage demographic insights to personalize app experiences. Outcome: Improved engagement, increased retention, and higher revenue potential. |
Geographical Variations: How Mobile App Usage Statistics Differs Across Regions
Mobile app adoption and engagement levels exhibit significant regional differences, influenced by smartphone penetration, internet availability, and local consumer behavior. Understanding these geographical trends is crucial for businesses aiming to optimize their app strategies for diverse markets.
Each region brings unique opportunities and challenges, from language preferences and spending habits to favored app categories. Businesses that leverage localized insights can unlock new growth potential and outpace competitors in targeted geographies.
23. Global Consumer Spending on Mobile Apps and Games
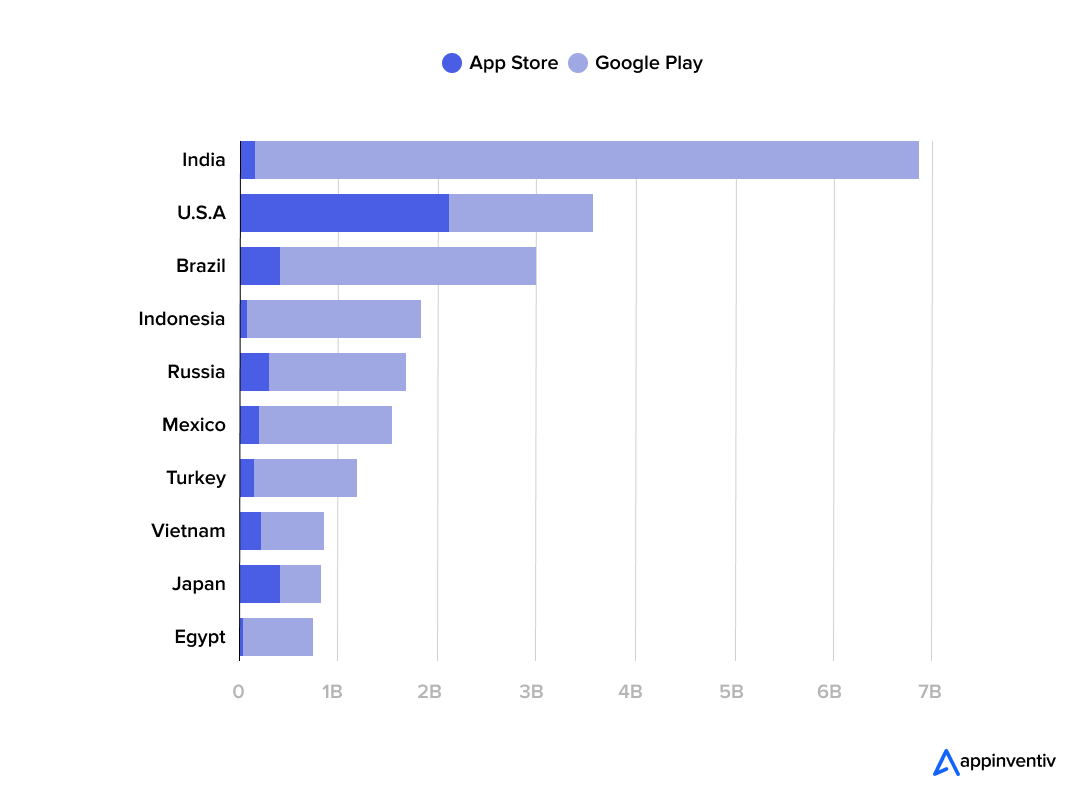
In 2024, global consumer spending on mobile apps and games reached $127 billion, reflecting a 15.7% increase from the prior year. (Source: People Daily)
24. eCommerce App Download
eCommerce app Temu topped the charts as the most downloaded app in the United States for the second consecutive year, reaching 64 million installs. (Source: Business of Apps)
25. In-App Spending Via App Stores
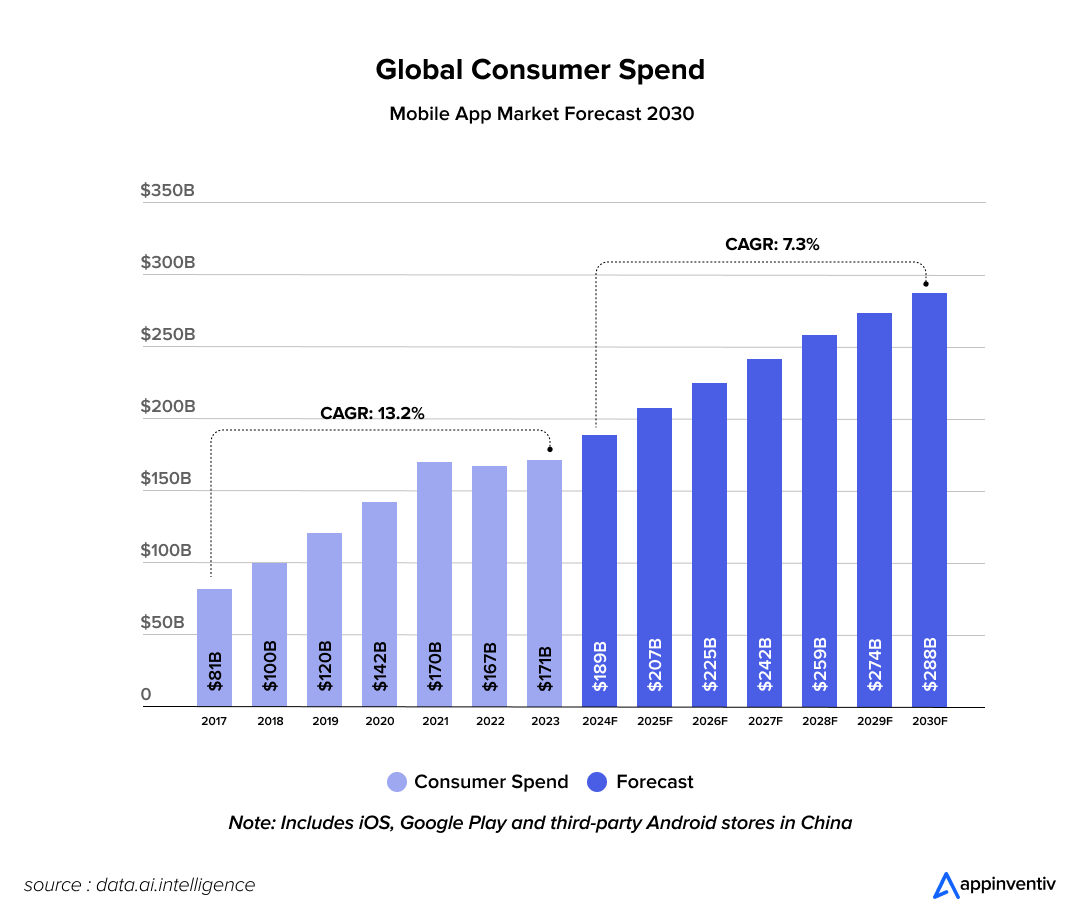
In-app spending via app stores is projected to surge by 267% between 2021 and 2030 compared to the previous decade, with total expenditures expected to hit $288 billion in 2030 alone. (Source: Sensor Tower)
26. Smart App Contribuiton in Retails
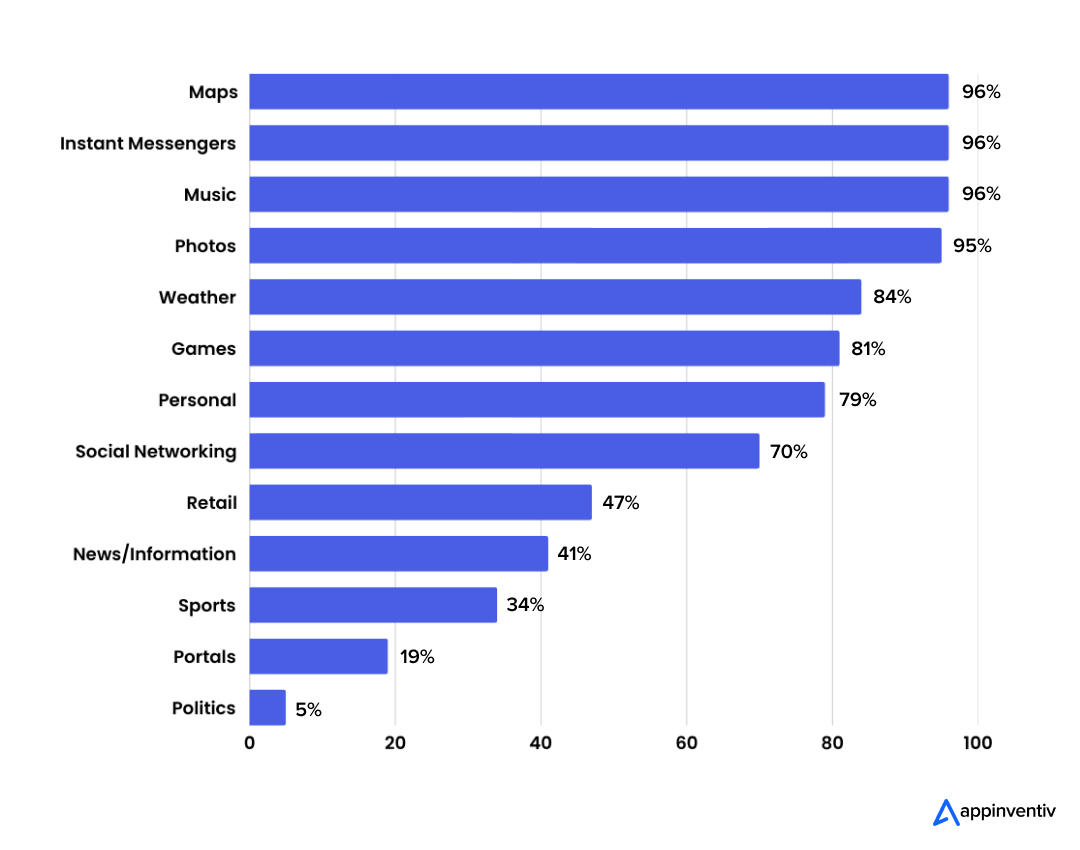
Smartphone apps contribute to 47% of retail consumption, with users also relying heavily on their phones to access news and information. Despite various digital platforms, smartphones dominate usage, accounting for just over 40% of overall digital engagement. (Source: Digital Gravity)
| Move: Tailor app experiences to regional preferences and user behavior. Outcome: Greater user adoption, improved retention, and stronger market penetration. |
Popular App Categories and Their Growth: Trends Shaping the Mobile Landscape
The mobile app ecosystem constantly evolves, with specific categories witnessing rapid growth fueled by shifting user preferences and cutting-edge innovations. Understanding these trends is vital for businesses and developers aiming to tap into high-potential segments and gain a competitive edge.
From casual gaming and social networking to finance and utility apps, users embrace mobile solutions that simplify, entertain, and enhance everyday life. The rise of hyper-personalization and on-demand services is also pushing newer categories into the spotlight. The mobile app development statistics from 2025 reveal powerful trends shaping how users interact with different types of apps.
Key insights on popular app categories:
27. TikTok Vs Instagram
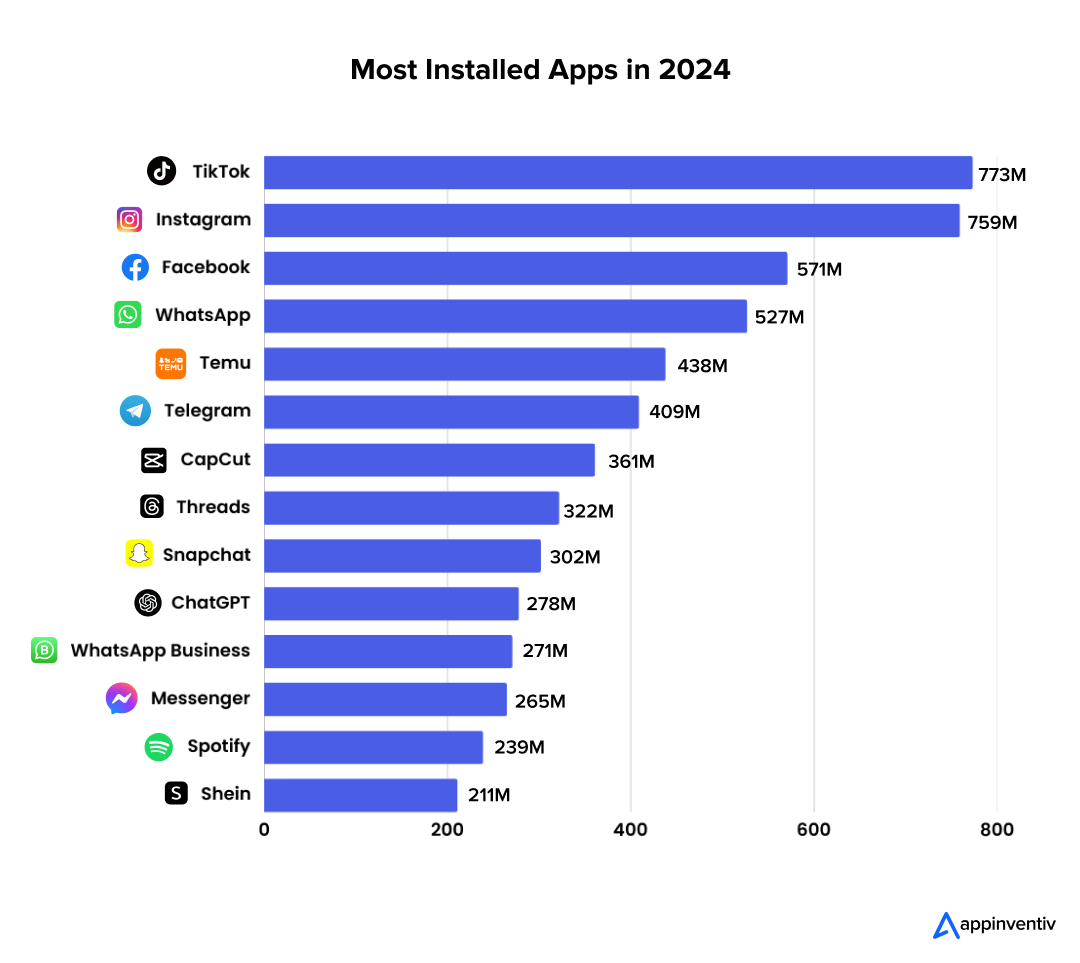
TikTok regained its position as the most downloaded app in 2024, overtaking Instagram, which held the top spot earlier. (Source: Business of Apps)
28. Instagram App Download Rate
By August 2024, social media apps like Instagram had garnered over 657 million downloads, highlighting the continued importance of digital connectivity and networking. (Source: Business of Apps)
29. Amazon App Download Rate
As of January 2025, the education category ranked second on the Amazon Appstore, offering over 23,000 free and around 6,000 paid apps. (Source: Statista)
30. Number of Shoppers Using Apps Over Mobile Websites
85% of U.S. mobile shoppers prefer to use apps as opposed to mobile websites. (Source: Capital One Shopping)
| Move: Businesses can shift their focus to content innovation, personalization, and seamless app experiences across various categories. Outcome: Higher download rates and greater user engagement. |
Revenue Tactics That Fuel Mobile App Download Growth
To accelerate mobile app downloads, businesses need to come up with strategic monetization approaches. Here are some top monetization strategies that can boost app visibility, user base, and profitability.
In-App Purchases (IAP)
This model allows users to download the app for free and then buy virtual goods, premium features, or extra content within the app. It offers flexibility and personalization, allowing users to pay for only what they value.
Subscription Models
Users pay a recurring fee to access premium content or features, monthly or annually. This model ensures a steady revenue stream and encourages continuous value delivery and updates. It is especially effective for content-driven and utility-based apps that offer long-term value.
Affiliate Marketing & Partnerships
Apps generate revenue by promoting third-party products or services through affiliate links or strategic partnerships. It creates passive income opportunities without charging users directly for app use.
Hybrid Monetization Models
Combining two or more app monetization strategies, like offering a free version with ads and a premium ad-free version, lets apps cater to different user segments. This approach effectively balances user acquisition with revenue optimization.
Also Read: App Monetization Guide: 7 Strategies and Models Overview
Mastering User Retention: Key Challenges and Proven Solutions
Keeping users engaged and coming back is no easy feat in today’s competitive digital landscape. Check out some of the most common user retention and engagement challenges and offer practical solutions to fix them.
Lack of Personalization
Many users drop off when they feel the product or service doesn’t meet their needs. A universal solution experience fails to keep them engaged or coming back. Without personalization, users are more likely to forget your offering in favor of one that feels more tailored.
Today’s digital users expect intelligent recommendations and relevant content. Ignoring behavioral data or user preferences often results in lower engagement. To retain users, personalization needs to be baked into every step of their journey.
Also Read: Tips on Making Your Mobile App Successful
Friction in Onboarding
A confusing or time-consuming onboarding process can be a deal-breaker. If users aren’t quickly shown how your product helps them, they’ll leave without a second thought. Many products overwhelm users with too much information too soon.
Others don’t provide enough guidance, leaving users stuck and frustrated. A seamless onboarding flow should focus on quick wins and clarity. The goal is to make the user feel confident and empowered from the very beginning.
Poor User Engagement Strategy
They’ll gradually disengage without a consistent and meaningful way to interact with users. Sporadic or irrelevant push notifications and emails often do more harm than good. Engagement isn’t about volume but timing, context, and value.
Users need nudges that feel helpful, not annoying. Whether through in-app messages, newsletters, or content updates, your strategy should aim to nurture habits and spark interest. A thoughtful engagement loop can turn casual users into loyal ones.
Users Don’t See Long-Term Value
Even if users initially like your product, they may churn if they don’t see continued value. Many apps or platforms fail to show users what’s next after they complete the first few tasks.
Retention requires a roadmap; users need reasons to return beyond the first use. This could include feature unlocks, ongoing challenges, or helpful content. Without a plan to keep delivering value, users will eventually lose interest and move on.
Mobile App Market Trends 2025 and Beyond: What’s Shaping the Next Generation of Apps
The mobile app industry is entering a transformative era, fueled by advanced technologies, shifting consumer behaviors, and a heightened emphasis on intelligent, user-centric experiences. Below are the key trends poised to shape the next generation of apps and redefine mobile app development standards in 2025 and beyond.
AI-Native App Design
In the evolving mobile app development market, future apps will be designed with AI at their core, not as an afterthought. These AI-native apps will adapt, learn, and grow continuously, delivering hyper-personalized user experiences without frequent updates. This shift is a key driver of mobile app development growth in 2025 and beyond.
Ambient Health Monitoring via Passive Data
Health and wellness apps will increasingly rely on passive sensor data from wearables and mobile devices. This non-intrusive approach empowers real-time medical diagnostics and proactive health alerts, supporting the growing demand in mobile app user statistics. The trend is especially strong in healthcare mobile app development.
Emotion-Aware Mobile Interfaces
Leveraging affective computing, emotionally intelligent apps will recognize user moods and tailor responses accordingly. This innovation improves engagement, addressing issues seen in mobile app retention rate statistics, where users often churn due to impersonal or rigid app experiences.
App-as-a-Micro-Service (AaaMS) Frameworks
A significant evolution in the mobile app development market is the shift toward microservice-based architecture. This approach breaks apps into independently deployable modules, enabling faster releases and more agile scaling, which contributes to long-term mobile app development growth and improved app maintenance.
Optimize Your Digital Strategy with Appinventiv
In a mobile-first world where user expectations constantly evolve, staying ahead means more than just launching an app. It requires delivering intelligent, intuitive, and immersive digital experiences. As mobile app development trends move toward AI-native design, predictive UX, and decentralized ecosystems, businesses must adopt a future-ready strategy that fuses innovation with agility.
This is where Appinventiv steps in—not just as a mobile app development services partner, but as a digital transformation catalyst that helps organizations rethink how they connect with users, create value, and drive sustainable growth.
With a robust portfolio of high-impact mobile solutions, Appinventiv has helped some of the world’s most recognized brands redefine their digital presence. From building seamless food ordering experiences for global giants like Domino’s to crafting personalized shopping journeys for Adidas, Edamama, and 6th Street, our team blends deep domain expertise with innovative technologies to deliver apps that scale effortlessly and engage users meaningfully. It might be optimizing performance, improving retention, or unlocking new revenue streams, but our experts deliver the best with precision to you.
Ready to transform your digital strategy into a competitive advantage? We can help you lead the change.
FAQs
Q. Why should businesses care about mobile app usage statistics?
A. Mobile app usage statistics offer critical insights into user behavior, preferences, and engagement trends. These data points help businesses refine their product strategies, improve retention, and make data-driven decisions to enhance user satisfaction and ROI.
Q. How can app download statistics influence my marketing strategy?
A. App download data reveals where user interest is growing and which platforms or categories are gaining traction, critical for positioning within the competitive mobile app development market. By aligning your marketing strategy with these trends, you can improve visibility, optimize your acquisition funnel, and ensure your brand capitalizes on ongoing mobile app development growth.
Q. What are some key indicators of a successful mobile app beyond download numbers?
A. Here are some of the key indicators of a successful mobile app that reflect real user engagement, long-term value, and overall performance:
- Daily Active Users (DAU): This measure measures how many users engage with your app on a daily basis, indicating consistent value delivery.
- Retention Rate: Shows how well your app retains users over time—an essential metric for long-term success.
- Session Duration: Tracks how long users spend in the app, reflecting the depth of engagement and content relevance.
- Churn Rate: This indicator identifies the percentage of users who stop using the app after a certain period, helping pinpoint experience gaps.
- Feature Usage Patterns: Helps understand which functionalities drive the most engagement and which need improvement.
- User Feedback and Ratings: Offers qualitative insights into user satisfaction, bugs, and improvement areas.
- Leveraging Mobile App Users Statistics: Enables data-driven decision-making to enhance user experience and support sustained growth in development.
Q. What are some of the top mobile app market trends in 2025?
A. The mobile app development market in 2025 is being shaped by several forward-looking trends that reflect changing user behaviors and technological advancements:
- AI-Native Mobile Apps
- Voice-Driven Interfaces
- Emotion-Aware Experiences
- Decentralized Apps (dApps)
- Sustainable & Ethical App Design
- Edge Computing Integration
- Super Apps & Mini Programs


- In just 2 mins you will get a response
- Your idea is 100% protected by our Non Disclosure Agreement.

Step-by-Step Guide to Digital Tipping Platform Development for Australia: Features, Costs & ROI
Key takeaways: Digital tipping is now a system-level decision Once tips move through digital payments, they intersect with payroll, reporting, and workforce trust. Informal handling does not scale. Sector-specific design determines success Cafés, restaurants, hotels, delivery services, and franchises each require different allocation logic and operational controls to reflect how work is delivered. Cost reflects…

Building a Future Ready Real Estate Platform in Qatar for Vision 2030
Key Takeaways Future-ready real estate platforms in Qatar are treated like infrastructure, not apps. They’re built to last, with strong data, clear governance, and room to adapt as policies and projects evolve. Off-the-shelf tools work only until complexity shows up. Once approvals, compliance, and multiple stakeholders are involved, custom platforms usually hold up far better.…

Investing in the Future: Why Arabian Education App Development is Surging
Key Takeaways: Education apps in the Arabian region are no longer stopgap solutions. They’re becoming part of how learning actually runs day to day. Schools, universities, and governments are choosing platforms that scale quietly and fit real teaching routines. The apps that succeed focus on stability, integration, and usability rather than packed feature lists. Most…


