




















How Do Apps Make Money? A Practical Monetization Guide


- How Do Apps Make Money? Why Monetization Decisions Matter for Your Business
- Strategic Foundations Before You Choose A Mobile App Business Model
- How Do Free Apps Make Money? (With and Without Ads)
- Core Mobile App Monetization Strategies: The Four Model Families
- Comparing Key App Monetization Models
- App Monetization Examples By Category
- A 5-Step Framework To Choose The Right Mobile App Business Model
- How To Monetize Without Hurting User Experience?
- AI-Powered App Monetization: Moving From Guesswork To Evidence
- Measuring If Your App Monetization Is Actually Working
- Challenges In App Monetization and How To Handle Them
- Emerging Monetization Trends Shaping How Apps Make Money
- How Appinventiv Helps You Build Apps That Actually Make Money?
- FAQs

Key takeaways:
- Design monetization from day one: align product value with revenue model to maximize app development ROI.
- Understanding how do free apps make money starts here: ads, freemium, IAPs, subscriptions, transactions, or enterprise deals—pick the right combination.
- Use AI and real-time analytics to personalise offers, reduce churn, and increase ARPU across user cohorts.
- Optimize UX, and checkout flows—small performance gains often translate directly into significant conversion uplift for revenue.
- Enterprise apps monetize best through licensing, white-labeling, data products, and lead-generation tied to measurable outcomes.
The app stores don’t show you the metric your board actually cares about: revenue per user, not stars per review.
Most enterprises already have apps in the market. Some have a few. Others have a whole portfolio. Yet the same question keeps coming up in review meetings: “How do apps make money for us, beyond brand presence?”
That question gets sharper when most of your products are free to download. The CFO sees millions of installs. The P&L (profit & loss reports) shows a very different story.
It is important to understand how do free apps make money in a way that fits your business model, risk appetite, and growth targets. This guide is written with that lens. We will unpack how mobile apps make money across ads, in-app purchases, subscriptions, transactions, and B2B models. We will also look at where AI, pricing experiments, and data-driven decisions actually move the needle on app development ROI.
Whether you are planning a new product or fixing an underperforming one, the goal is simple. By the end, you should know which monetization paths make strategic sense for your app, and which ones you can safely ignore.
Our monetization frameworks have driven 23% conversion lifts and 30K+ daily orders for leading brands.
How Do Apps Make Money? Why Monetization Decisions Matter for Your Business
If you sit in on most product or leadership meetings today, the conversation usually lands on one thing. Not whether the app should exist, but whether it is actually pulling its weight financially.
Why monetization shapes app development ROI:
- Global app revenue is expected to hit $673 billion by 2027, with $151 billion added between 2024 and 2027, according to Statista
- That growth comes from apps people return to and pay for, not just installs
- Pricing decisions and feature access quietly shape margins and how investors judge the product
- When monetization is added late, teams often see falling retention and disappointing returns
Teams that think about monetization early make better product choices. Features, data, and pricing grow together, making it easier to forecast revenue and decide which apps deserve more investment.
Strategic Foundations Before You Choose A Mobile App Business Model
Before you decide on ads, subscriptions, or in-app purchases, you need the basics in place. Most failed monetization is not about price. It is about unclear value, unclear users, and rigid tech. If you are serious about how to make money from an app, these four checks are essential.
1. Start With The Core Value, Not The Price Tag
Ask one simple question first: what job does this app do better than anything else?
Is it saving time, cutting risk, growing revenue, or improving visibility for leaders? A meditation app will monetize very differently from a field-service app.
If the app is free to download, you still need to know the “upgrade moment.” Is it more capacity, richer insights, premium content, or extra control?
Also Read: Cost to Develop a Meditation App Like Calm: Everything You Need to Know
2. Know Who You Serve And What They Will Pay For
Two similar apps can have very different economics. A B2C fitness app relies on volume. A B2B logistics app may have fewer users but higher value per account.
You need clarity on:
- Who decides to pay, and who uses the app daily
- How often will they use it?
- What outcome justifies a fee or upgrade
Free apps are where the question “how do free apps make money” becomes practical. Price-sensitive users may accept in-app advertising revenue or a light freemium model. Senior executives may reject ads but pay for deeper analytics, governance, or integrations.
Also Read: Fitness App Development in 2026 – A Complete Guide
3. Study Your Category With A Monetization Lens
Do not just copy competitor features. Look at how do mobile apps make money in your space today.
Check:
- Which models dominate: ads, IAP, subscriptions, commissions
- What users complain about in reviews
- How others draw the line between free and paid
This helps you avoid known mistakes and spot gaps. For example, if every app is ad-heavy, there may be room for a cleaner premium tier. That is where strong app monetization examples often come from.
4. Make Sure Your Tech Stack Can Actually Support Your Plans
Great monetization ideas fall apart when the stack is inflexible. You do not want every small pricing change to become a rebuild.
From day one, plan for:
- Payments, subscriptions, and in-app purchases
- Feature flags for testing tiers and bundles
- Analytics tied to key journeys
- Optional integration with app monetization platforms and referral partners
For free apps, this flexibility is crucial. You might start with a simple freemium, then add ads or affiliate flows as you learn how to make money on apps in your market.
Getting these foundations right does not guarantee success. But it gives every monetization decision a solid base and improves your chances of seeing real app development ROI, not just download spikes.
How Do Free Apps Make Money? (With and Without Ads)
Most apps your customers see in the store are free to install. Your finance team knows they are not free to build, run, or scale. So the real question evolves from ‘Can we launch a free app?’ to ‘How do free apps make money in a way that fits our business?
A major driver of that answer is ads and subscriptions. In-app advertising alone is forecasted to reach $390 billion by 2025 and exceed $533 billion by 2029. At the same time, subscription-based app revenue models are on a parallel boom, with digital content and media subscriptions expected to generate $1.26 trillion globally between 2021 and 2025.
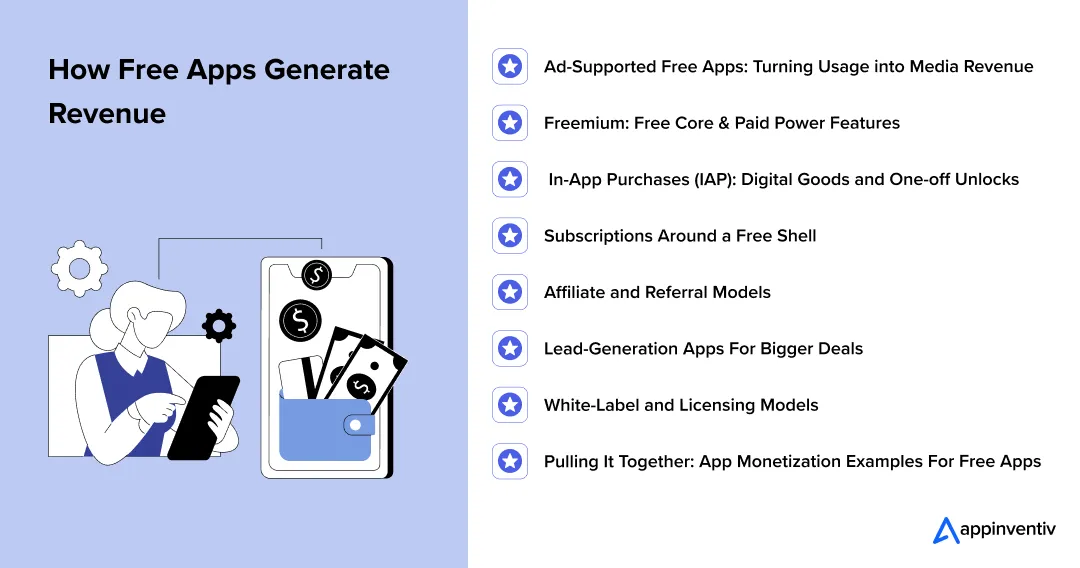
At a high level, free apps make money in three broad ways:
- Monetizing attention through ads and sponsorships.
- Monetizing value through upgrades, in-app purchases, and subscriptions
- Monetizing outcomes through transactions, leads, or enterprise deals
Gully Beat is a practical example: the app turned music-led challenges into a monetizable attention layer for a national film campaign, showing how high engagement translates into sponsorship and activation revenue.
The right mix depends on your category, your brand, and how critical the app is to users. Let’s break down the main models, with pros, cons, and where they fit.
1. Ad-Supported Free Apps: Turning Usage into Media Revenue
This is the most familiar pattern. The app is free. You earn from in-app advertising revenue while users interact with content or features.
Common formats include:
- Banner and native ads in feeds or reading views
- Interstitial or video ads between levels, screens, or sessions
- Rewarded ads where users watch a clip to unlock a perk
How the money flows: You connect the app to one or more app monetization platforms or ad networks. They fill your available inventory with targeted ads and pay you based on impressions, clicks, or completed views.
Revenue scales with active users, session time, and ad quality. Free games are some of the clearest examples of how free apps make money through in-app purchases and ads.
Pros:
- Keeps the app completely free at the point of download
- Easy entry if you already have strong traffic or engagement
- Simple to switch networks and optimise fill rates over time
Cons:
- Poor placement or frequency can hurt UX and retention
- Revenue is volume-driven and can be volatile in the market
- Difficult to justify in trust-sensitive categories like health or finance
Best for: News, media, casual games, entertainment, and utility apps where users are used to seeing ads and do not expect a premium feel.
Platforms like MOXY show a related pattern—using community engagement to drive sponsorships and memberships rather than pure display ads, proving attention can monetize without degrading UX.
2. Freemium: Free Core & Paid Power Features
With freemium, your app answers “how to monetize a free app” by drawing a clear line between basic and advanced value.
- The core experience is free and useful on its own.
- Power features, extra capacity, or more control sit behind a paywall.
Examples: extra projects in a project tool, advanced filters in a design app, or admin features in a B2B product.
Pros:
- Free tier drives acquisition and trial with minimal friction
- Users only see the paywall after they have experienced real value
- Easy to align pricing with usage tiers or roles
Cons:
- If the free tier is too generous, upgrades stall
- If it is too limited, users churn before they see value
- Requires careful design of limits, prompts, and upgrade timing
Best for: Productivity apps, B2B tools, SaaS companions, and any product where value deepens with regular use.
3. In-App Purchases (IAP): Digital Goods and One-off Unlocks
In-app purchases let you make money from a free app by selling specific items or unlocks inside the experience.
Typical patterns include:
- Consumables like coins, boosts, or extra lives in games
- Permanent unlocks, such as pro features or content packs
- Cosmetic items like themes, avatars, or skins
Pros:
- Very flexible pricing, from micro-transactions to bigger bundles
- Let heavy users spend more without blocking casual users
- Works well with events, seasons, or time-limited offers
Cons:
- Needs strong engagement loops and a clear perceived value
- Easy to create confusing or aggressive offer flows
- Revenue often depends heavily on a small group of power users
Best for: Games, wellness apps, learning platforms, and any app where users can meaningfully improve their experience through add-ons rather than a global subscription.
4. Subscriptions Around a Free Shell
Here, the app is free to download and often free to try. The serious value lies behind monthly or annual plans.
You might offer:
- A limited free tier with usage or feature caps
- A time-boxed free trial for all premium features
- A mix of both in different markets
Pros:
- Predictable recurring revenue and better planning
- Strong fit for ongoing journeys like health, finance, and skills
- Easier to link price to outcomes rather than one-off actions
Cons:
- Users are wary of yet another subscription
- Churn can offset growth if the value is not obvious and continuous
- Requires a steady roadmap and content investment
Best for: Health and wellness apps, finance tools, education platforms, and B2B products that become part of daily or weekly work.
5. Affiliate and Referral Models
In this model, the app stays free, and you earn money from free apps by sending users to partner products.
Examples:
- A finance app that recommends cards, loans, or accounts
- A travel app that forwards users to booking partners
- A shopping or comparison app that sends traffic to merchants
Partners pay you when users click, sign up, or complete a purchase.
Pros:
- No paywalls or direct charges for users
- Strong upside in high-intent niches like travel and finance
- Easy to combine with freemium, IAP, or subscriptions
Cons:
- Revenue depends on partner conversion and tracking accuracy
- If you push offers too hard, you lose trust
- Disclosure and compliance rules vary by market
Best for: Finance, travel, e-commerce, comparison, and review apps where recommendations are already part of the experience.
6. Lead-Generation Apps For Bigger Deals
Here, the app itself may never collect a cent directly from users. Instead, it demonstrates how to generate money from free apps by feeding your sales funnel.
Patterns Include:
- A free diagnostics or audit app for enterprise systems
- A workflow app that exposes pain points that a larger platform solves
- A reporting or dashboard app for existing prospects
The value appears when users or organisations move from the free app into paid contracts, projects, or licences.
Pros:
- Very high value per converted account or deal
- You can keep the app clean, ad-free, and premium
- Strong way to support complex, consultative sales cycles
Cons:
- Revenue feels indirect without tight tracking
- Sales cycles can be long and involve many stakeholders
- Needs close coordination between product, sales, and marketing
Best for: Enterprise software vendors, consultancies, managed service providers, and any business where the real revenue sits in high-value contracts.
7. White-Label and Licensing Models
White-label and licensing models treat your app as a platform, not just a product. Users see a free app. Your business sees recurring B2B income.
Approaches Include:
- Offering the same app under different brands and skins
- Licensing your engine or modules to other organisations
- Selling sector-specific versions for banks, retailers, or hospitals
Pros:
- High-margin, recurring revenue once the platform is mature
- Let’s you spread development costs across multiple clients
- Strong fit for niche workflows or regulated industries
Cons:
- Requires clear contracts, SLAs, and IP protection
- Support and feature requests can grow with each client
- Product roadmap needs a balance between shared and custom needs
Best for: Platforms in logistics, healthcare, retail, education, or financial services where many players share similar needs but want their own brand.
8. Pulling It Together: App Monetization Examples For Free Apps
To make this less abstract, here are a few combined app monetization examples that reflect how enterprises actually operate:
Free wellness app for employees
- Model: Free for staff, subscription for the employer
- Users get guided programs, check-ins, and content at no cost.
- HR or the organisation pays per employee or per active user for access, analytics, and reporting.
Free field-service app
- Model: Lead-gen + enterprise licensing
- Technicians use a free app to log jobs, photos, and parts.
- The business pays for the management console, integrations, and advanced analytics.
Free retail loyalty app
- Model: Affiliate + in-store uplift + sponsorships
- Shoppers access offers, points, digital receipts, and events.
- Revenue comes from partner deals, higher spend per visit, and sponsored campaigns from brands.
Free industry news app
- Model: Ads + premium research subscription
- Free tier offers daily news and alerts with light advertising.
- Paid tier unlocks deep reports, research dashboards, and ad-free reading for decision makers.
Each scenario keeps friction low at the store level. Users do not pay to try the app. Yet the path from usage to revenue is very deliberate. That is the real answer to how do free apps make money in an enterprise context: not through one clever trick, but through a business model designed around where your app genuinely creates value.
Core Mobile App Monetization Strategies: The Four Model Families
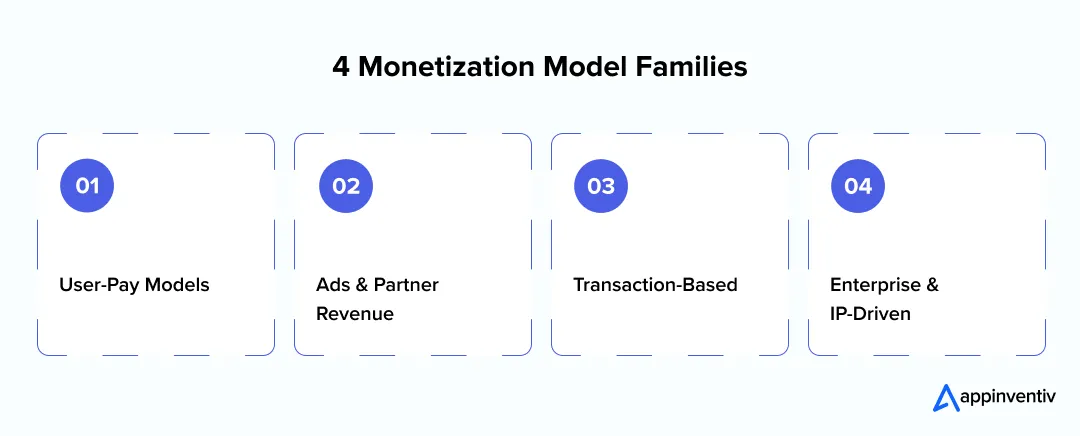
Once you understand how do mobile apps make money, it helps to zoom out. Most serious products don’t rely on one tactic. They mix a few mobile app monetization strategies from four broad families, depending on their market, brand, and growth stage.
This is especially true in the enterprise space. According to IDC, revenues from enterprise applications are set to cross $600 billion by 2028, driven by the deeper integration of AI, machine learning, and GenAI. In that environment, the way you design your revenue mix becomes just as important as the features you ship.
Think of these as your monetization “building blocks.” You rarely need all of them. You do need to pick the right mix.
1. User-Pay Models
Here, users pay you directly.
- Paid apps: One-time download price.
- In-app purchases: Users buy specific features, content, or digital goods.
- Freemium: Core is free, and advanced tools or capacity are paid for.
- Subscriptions: Recurring monthly or annual access.
These models work best when your app delivers a clear, repeated outcome: better focus, smoother workflows, faster approvals, deeper insight.
2. Ads and Partner Revenue
Here, you make money from an app by monetizing attention and intent, not direct payments.
- In-app advertising revenue from banners, native placements, video, or rewarded ads
- Affiliate and referral flows that earn commission on sign-ups or purchases
- Sponsorships and branded sections funded by partners
These strategies lean on strong traffic and engagement. You plug into app monetization platforms and partner networks rather than billing users yourself.
3. Transaction-Based Models
Here, your app acts as a transaction engine and gets paid when money moves.
- Commission-based marketplaces: You take a cut on each order, booking, or match
- Embedded financial services: Credit, insurance, payouts, or wallets integrated into core flows
This approach suits e-commerce, food delivery, mobility, rentals, gig platforms, and any product that sits between buyers and sellers.
In QSR, the link between flow friction and revenue is direct: Domino’s saw a 23% uplift in conversions after Appinventiv rebuilt its mobile ordering funnel, while Pizza Hut recorded nearly 30% higher conversions with faster flows and simplified decisions.
4. Enterprise and IP-Driven Models
In this family, the app is part of a broader mobile app business model, not the whole business.
- White-label and licensing deals: Other organisations pay to use your platform under their brand
- Data and insight products: Aggregated, anonymised analytics sold as dashboards or reports
- Lead-generation apps: Free tools that feed larger software or service contracts
These are the models that often show up in enterprise-grade app monetization examples. They tie app usage to revenue lines your board already knows: licences, services, and contracts.
Once you see which family matches your ambition and category, it becomes much easier to decide how you will make money from an app and which ideas belong on your roadmap, not just in a pitch deck.
Comparing Key App Monetization Models
Use this table as a quick lens on how do apps make money under different structures. It is not exhaustive, but it will help you shortlist the right mobile app business model before you go deep.
| Monetization Model | Works For Free Apps? | Best For | Revenue Logic | Watch Out For |
|---|---|---|---|---|
| In-App Ads | Yes | News, media, casual games, utilities | In-app advertising revenue from views/clicks | UX damage if ads are intrusive; volume dependence |
| Freemium | Yes | Productivity, SaaS, creative, B2B tools | Free core, paid advanced features/capacity | Giving away too much or too little in the free tier |
| In-App Purchases (IAP) | Yes | Games, wellness, learning, content hubs | One-off digital goods or unlocks | Over-complex offers; revenue driven by a small user segment |
| Subscriptions | Yes | Health, finance, education, and B2B platforms | Recurring monthly or annual fees | Subscription fatigue, churn, constant need for fresh value |
| Paid App (Upfront Price) | No | Niche pro tools, specialist utilities | One-time download payment | Higher install friction; no built-in recurring revenue |
| Affiliate/Referral | Yes | Finance, travel, shopping, comparison apps | Commission on sign-ups or purchases | Partner quality, tracking accuracy, disclosure rules |
| Commission Marketplace | Yes | E-commerce, delivery, rentals, gig and booking platforms | Percentage of each completed transaction | Payments, disputes, fraud, and regulatory load |
| Embedded Financial Services | Yes | Marketplaces, B2B tools, vertical platforms | Fees on credit, insurance, payouts, or wallets | Compliance, risk, and integration complexity |
| Lead Generation App | Yes | Enterprise software, services, consulting | App-generated leads that convert to large deals | Indirect revenue, long sales cycles, need for attribution |
| White Label/Licensing | Yes | Logistics, healthcare, retail, education, and financial services | Licence fees or usage-based B2B contracts | IP protection, support effort, roadmap pressure |
| Data/Insight Products | Yes | High-volume B2C, fintech, retail, mobility | Anonymised analytics sold as reports or dashboards | Privacy laws, consent, and reputation impact |
This is where the question “how do apps make money” stops being generic. You can now see which 2–3 models naturally fit your users, your category, and the outcomes your board wants to see.
App Monetization Examples By Category
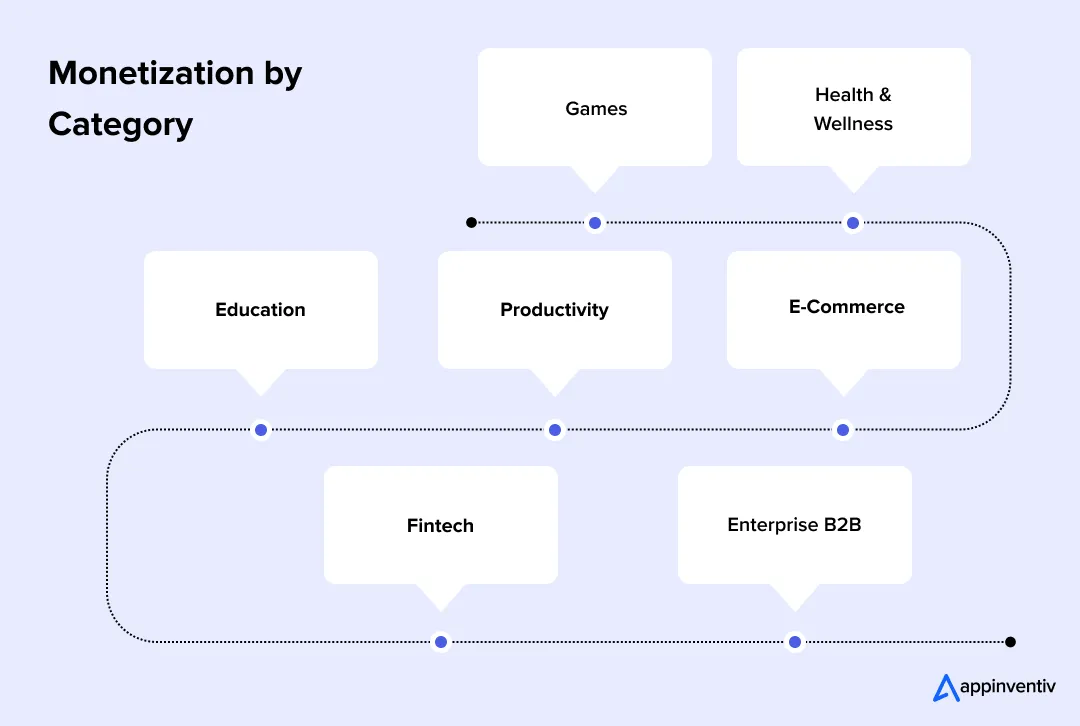
Now that we have the models on the table, it helps to see how do mobile apps make money in real product contexts. Different categories lean towards different mixes, even if the apps are free at the store level.
Below are practical app monetization examples you can map to your portfolio.
1. Games
Free games are some of the clearest answers to “how do free apps make money.”
Most common models:
- Freemium access
- In-app purchases for coins, skins, and levels
- Rewarded and interstitial ads
Also Read: Everything You Need to Know About Game App Development
2. Health and Wellness
Here, trust and routine matter more than raw installs.
Most common models:
- Free app with subscription programs
- One-off IAP for courses, challenges, or packs
- Employer or insurer-funded access in B2B scenarios
Also Read: The Ultimate Business Guide to Healthcare Mobile App Development
3. Education and Learning
Users want depth, structure, and visible progress.
Most common models:
- Freemium content with paid tracks or certificates
- Subscriptions for full course libraries or live classes
- Licensing to schools or enterprises for group access
Also Read: How Much Does It Cost to Build an Educational App?
4. Productivity and Collaboration
These apps often sit at the heart of daily work.
Most common models:
- Free tier with limits on projects, seats, or storage
- Paid tiers for advanced features, security, and admin control
- Enterprise contracts for SSO, compliance, and integrations
5. eCommerce and Marketplaces
Here, the app itself rarely collects money from users directly. It orchestrates transactions.
Most common models:
- Commission on each order or booking
- Seller subscriptions and promoted listings
- Embedded payments, credit, or insurance fees
Also Read: Comprehensive eCommerce Application Development Guide: Everything You Need to Know
6. Fintech and Personal Finance
Trust is everything. Users will not tolerate noisy monetization.
Most common models:
- Affiliate and referral fees on cards, loans, or accounts
- Paid premium tiers with analytics, coaching, or automation
- Transaction spreads or subscription fees for advanced tools
Also Read: How to Build an Effective Personal Finance Application?
7. Social and Creator Platforms
If you are wondering how social media apps make money, then here is the answer: the value lies in community and attention, not just features.
Most common models:
- Ads in feeds and stories
- Creator tipping, gifting, and subscriptions
- Brand deals and sponsored content formats
Also Read: How to Estimate the Social Media App Development Cost Budget?
8. Enterprise and B2B Apps
This is how an app makes money, which often looks very different from consumer products.
Most common models:
- Licence or subscription paid by the organisation
- White-label and industry-specific versions
- Free companion apps that extend a larger platform
Once you know which pattern your product sits closest to, you can stop asking “how do apps make money” in the abstract. You can start refining a model that fits your category, your users, and your board’s expectations.
A 5-Step Framework To Choose The Right Mobile App Business Model
At this point, you know the menu. Ads, IAP, subscriptions, commissions, enterprise deals. The harder part is picking what fits your app and your balance sheet.
This is where many teams stall. They ask, ‘How does an app make money?’ when they should ask, ‘How should our app make money, given our users and goals?’
Use this five-step framework as a decision filter before you ship anything.
Step 1: Map The Value Journey and The “Win Moments”
Do not start with price. Start with moments of value. Ask:
- When does a new user first say, “This is useful”?
- When do they say, “I would miss this if it went away”?
- When does your app impact a KPI your board cares about?
Those “win moments” are your natural monetization points. That is when a paywall, plan upgrade, or upsell feels fair, not forced.
If you cannot mark these moments on a simple journey, you are not ready to decide how to make money from an app yet.
Step 2: Segment Users By Platform, Persona, and Geography
Not all users behave the same way. A single mobile app business model rarely works globally without tuning.
Look at three lenses:
- Platform: iOS vs Android behaviour, spend, and expectations
- Persona: end user vs manager vs buyer (End users drive adoption, managers drive rollout success, buyers control budget and approvals.)
- Region: income levels, payment habits, and competition
Example:
- In some markets, ad-supported free apps perform well on Android.
- In others, iOS users accept subscriptions more easily than frequent micro-purchases.
This step stops you from copying a global average that fits no one.
Step 3: Pick One Primary Model and One Or Two Supporting Models
Most strong products that are learning how to make money on apps do not stack five models. They pick one main engine and one or two supporting streams.
For example:
- Free app + freemium + subscription for power users
- Free app + in-app purchases + light ads in non-core screens
- Free app + lead-generation + enterprise licensing
Your primary model should answer:
- Where does most revenue come from if things work?
- Does that line up with the value journey from Step 1?
- Can we explain it to a user in one or two sentences?
Supporting models then add depth, not confusion. If users cannot tell how you earn money, they will question your incentives.
Step 4: Design Pricing, Tiers, and Localisation
Once the model is clear, you can talk about price. Not before.
Work through four decisions:
- Entry point: Free, trial, or low one-time price?
- Tiers: Clear differences between free, standard, and premium.
- Local pricing: Adjust by country, currency, and competitive set.
- Commitment: Monthly, annual, or usage-based plans.
For free apps, this is where you decide how to monetize a free app without breaking trust. A generous free tier can drive adoption, while a smart upgrade path supports app development ROI. Keep pricing simple enough that a busy executive can understand it in one slide.
Step 5: Instrument Everything and Treat Monetization As An Experiment
Even the best-designed model is a hypothesis. You need data to prove or change it.
At minimum, track:
- Sign-ups and activation rates
- Conversion from free to paid, per cohort
- ARPU- Average Revenue Per User
- ARPPU – Average Revenue Per Paying User
- Churn by plan and by segment
- Payback period and LTV vs CAC
Use these signals to answer two questions quarter by quarter:
- Is this model helping us generate money from free apps in a sustainable way?
- Where are users dropping off, complaining, or paying less than expected?
The goal is not to change prices every week. The goal is to adjust structure, timing, and messaging based on evidence, not opinion.
When you follow these five steps, “how does an app make money” stops being a guess. It becomes a series of explicit choices you can explain to users, to your board, and to yourself.
Stop guessing what users will pay for. Our intelligent systems predict churn, optimize pricing, and personalize offers in real-time to maximize ARPU across every user cohort.
How To Monetize Without Hurting User Experience?
Good monetization makes the product stronger. Bad monetization makes every session feel like a toll booth. This is where many “free” apps lose the plot.
Below are practical guardrails on how to make money from an app without burning trust.
1. Integrate Monetization Into Natural Moments, Not Core Flows
The fastest way to lose users is to put every paywall in the way of the job they came to do. Here is what to do:
- Place upsell prompts after a positive moment: a completed workout, a closed ticket, a finished lesson.
- For in-app advertising revenue, use natural breaks: between levels, at the end of an article, or on recap screens.
- Keep mission-critical workflows (checkouts, approvals, clinical tasks) clean and distraction-free.
If users feel ambushed, they will not just ignore the offer. They will ignore the app.
2. Make Pricing and Value Clear
Confusion kills conversion. It also kills goodwill. To ensure clarity:
- Use simple language: “You get X, Y, Z for this plan” instead of jargon.
- Show real outcomes, not just feature names: “Share reports with your board in one click” is clearer than “Advanced reporting suite.z
- For free apps, state plainly what stays free forever and what is premium.
People are more willing to pay when they understand exactly what they are paying for.
3. Design Ads and Offers To Respect Your Brand
When deciding how to monetize a free app for banks, hospitals, or enterprise platforms, sloppy execution hurts more than it helps. To keep monetization aligned with your brand promise:
- Avoid low-quality ads or partners that clash with your brand promise.
- Cap frequency so users do not feel stalked.
- For affiliate or referral models, highlight why you picked these partners and what the user gains.
You are not just answering how to monetize a free app. You are setting the tone for every future digital product you launch.
4. Use Data To Refine, Not To Squeeze
Analytics should help you find the sweet spot between revenue and experience, not push every metric to the limit. To balance revenue gains with retention and trust:
- Track how each paywall, ad placement, or pricing test affects retention and reviews.
- Watch what happens to core usage when you add a new monetization touchpoint.
- Kill experiments that harm long-term engagement, even if short-term revenue looks good.
The aim is not just to make money on apps this quarter. It is to build a product that can support a durable business model for years.
5. Stay Ahead On Compliance and Consent
Monetization without trust is a short-lived win, especially for data-heavy models. To keep consent, privacy, and billing defensible under scrutiny:
- Be explicit about data collection, tracking, and billing terms.
- Follow platform rules for subscriptions, trial disclosures, and cancellation flows.
- Treat privacy regulations as design inputs, not legal footnotes.
A compliant, user-respecting model may feel slower to roll out. It is almost always cheaper than rebuilding your reputation later.
Also Read: 6 UI/UX Mistakes to Avoid for Successful App Development
AI-Powered App Monetization: Moving From Guesswork To Evidence
AI is most useful when it stops you guessing. Instead of one static paywall for everyone, you adjust offers, pricing nudges, and ad intensity based on how people actually use the app. The install base stays the same. The revenue per active user changes.
A. Smarter Targeting and Timing
AI models can score who is likely to convert, who is at churn risk, and who just needs more time. That lets you time upgrade prompts, discounts, and plan recommendations for the right cohorts instead of pushing the same message to everyone. Small lifts in conversion and churn here compound into real app development ROI.
B. Data Infrastructure You Actually Need
You do not need a research lab. You do need clean events, stable user IDs, and the ability to run experiments without a full release. If analytics cannot reliably tell you who activated, who pays, and who is slipping, no monetization model or algorithm will perform well.
C. Guardrails So Optimisation Does Not Damage Trust
AI can also push too far if left alone. Set clear limits on discount depth, paywall frequency, and which signals can be used. Make privacy, consent, and clear explanations part of the design. The point is not to squeeze users. It is to find a sustainable, data-informed way to improve how your app makes money over time.
Also Read: Top 8 things to consider for a profitable app development
Measuring If Your App Monetization Is Actually Working
You can have a clever pricing model and still lose money. For leadership, the real question is simple: Is this app paying its way over time?
That means tracking a small, focused set of metrics that connect user behaviour to revenue, not drowning in dashboards.
1. Arpu and Arppu: How Much Each User Is Really Worth
Average Revenue Per User (ARPU) tells you how much a typical active user brings in over a period. Average Revenue Per Paying User (ARPPU) zooms in on only those who pay.
If ARPU is flat but ARPPU is healthy, you have a conversion problem. If both are weak, your mobile app business model or pricing is likely off, not just your marketing.
2. Conversion and Churn: The Two Levers You Can’t Ignore
Two simple questions:
- How many people move from free to paid, and on which paths?
- How many paying users leave each month or quarter?
Free-to-play conversion shows whether your monetization story makes sense. Churn shows whether the value holds up once money changes hands. Together, they tell you if you are making money from an app in a sustainable way, or just running a leaky bucket.
3. Payback and LTV: Linking Monetization To Acquisition
If you spend on acquisition, you need to know:
- Payback Period: how long it takes to recover CAC from app revenue.
- Lifetime Value (LTV): how much a user brings in before they leave.
If payback is longer than your risk appetite, or LTV sits too close to CAC, no monetization trick will fix the core issue. This is usually where C-level discussions shift from “how do apps make money” to “should we keep funding this motion in its current form?”
4. Engagement and Monetization Events: Are We Charging At The Right Time?
Revenue without context is noisy. You also need to know how often users:
- Complete key actions (workouts, orders, tasks, lessons)
- Hit limits or friction points tied to upgrades
- See and respond to paywalls or offers
If users rarely reach your “win moments,” no wonder pricing feels harsh. If they reach them often and still do not convert, your mobile app monetization strategies need a rethink, not more volume.
5. Bringing It Together As App Development ROI
Finally, tie all of this back to app development ROI. Look at the full picture:
- Build and maintenance spend
- Marketing and acquisition cost
- Net revenue from the app over time
When the monetization model is right, these numbers tell a clear story: the app is either a profit centre, a strategic enabler, or a candidate for redesign. That clarity is what your board and your product teams both need before you decide what to build next, and what to quietly wind down.
Challenges In App Monetization and How To Handle Them
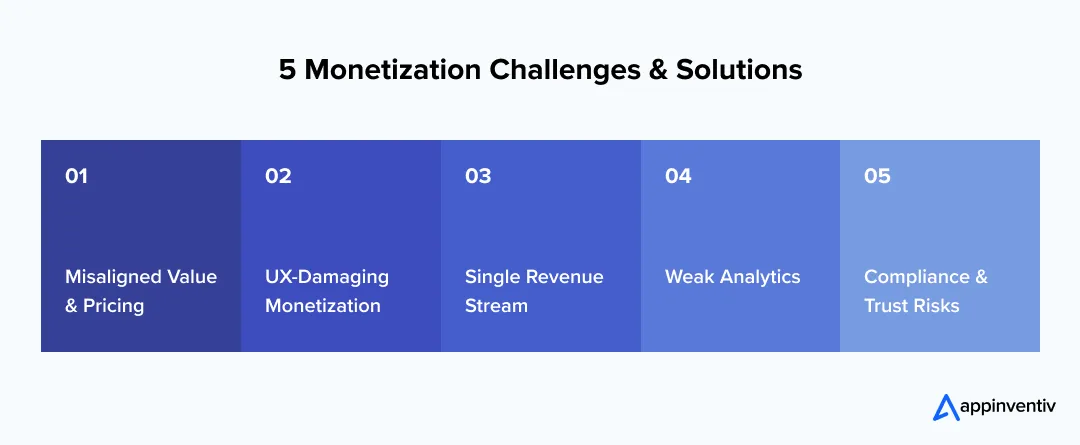
Even with a strong strategy, monetization can still misfire. The issues are usually not exotic. They are simple problems that compound over time if nobody addresses them directly.
1. Misaligned Value and Pricing
Biggest risk: the app is priced for your revenue target, not for the value your users actually feel.
- Symptoms: low upgrade rates, high trial drop-off, negative reviews about “paywalls everywhere.”
- How to handle it: Rebuild the story from the user’s point of view. Map the key outcomes they care about and price around those. Use plan names, limits, and messages that mirror real jobs: “analytics for leadership reports” lands better than “pro tier”.
2. Monetization That Hurts Core Experience
Ads, pop-ups, and paywalls can quietly destroy retention if they interrupt core tasks.
- Symptoms: usage drops after monetization changes; reviews mention “too many ads” or “hard to use now.”
- How to handle it: Move monetization to natural pauses or positive moments. Cap ad frequency. Test new paywalls on a small cohort first. If a change adds revenue but kills engagement, it is not a win at the C-level.
3. Over-Reliance On One Revenue Stream
Depending on a single model (only ads, only one IAP type, only one partner) makes the business fragile.
- Symptoms: revenue swings when ad rates shift, a partner changes terms, or store rules change.
- How to handle it: Pick one primary model, but design one or two secondary paths early. That might be a premium tier on top of ads, or enterprise contracts on top of a free tool. The mix matters more than any single idea.
4. Weak Analytics and Slow Experimentation
Many teams talk about “data-driven monetization” but run blind. Events are messy, cohorts are unclear, and pricing tests take months.
- Symptoms: arguments in meetings about what users want, no clear view of ARPU, ARPPU, or churn by plan.
- How to handle it: Fix the measurement before you tweak prices again. Standardise events, define a small core metric set, and ship controlled tests. A clean view of the funnel is worth more than another pricing workshop.
5. Compliance, Consent, and Trust Risks
Models based on data, ads, or referrals can drift into grey areas if not watched closely.
- Symptoms: unclear consent flows, confusing trials, or partner offers that feel opaque.
- How to handle it: Bring legal, security, and product into the same room. Design billing, data, and disclosure flows as first-class features. A monetization model that invites complaints or scrutiny is not scalable, no matter how good the spreadsheet looks.
Also Read: 11 Biggest Challenges in Mobile App Development
Emerging Monetization Trends Shaping How Apps Make Money
Monetization isn’t standing still. User expectations, platform rules, and payment habits keep shifting, and that directly changes how apps make money. If you are planning for the next three to five years, these emerging monetization trends matter more than any single pricing trick.
- AI-powered App Monetization and Dynamic Offers
AI-powered app monetization replaces fixed price charts with behaviour-driven decisions. Models learn from real usage, predict churn, and time offers more intelligently. Over time, the same install base can generate very different revenue when pricing, paywalls, and ad formats adapt to how people actually use the app.
- Hybrid and Modular Pricing Instead of One-Size-Fits-All
Hybrid pricing blends several models into one product. A free app might combine light ads, a solid freemium tier, and a premium subscription. Modular add-ons and usage-based extras then let you tune the mobile app business model for different segments and regions without rebuilding the product.
- Microtransactions and Bite-Sized Access
Microtransactions give users smaller, targeted ways to pay. Instead of a full subscription, they can buy a single report, feature, or short-term pass. This approach lowers the barrier for cost-sensitive or occasional users and helps mobile app monetization strategies capture value from people who would never commit to a long contract.
- Embedded Financial Services Inside Non-finance Apps
More apps that sit near transactions are adding financial layers. A marketplace can earn from instant payouts, built-in insurance, or instalment options at checkout. In these cases, the app does not only earn from core features. It also shares in the value created around each transaction.
Moo’s electric mobility app shows how pay-per-ride models produce predictable, volume-driven revenue. Its usage-based pricing is designed for rapid city-level expansion, typical of mobility monetization.
- Privacy-first and Consent-led Monetization
Data-heavy models now face tighter scrutiny, so monetization is moving toward privacy-first design. Contextual ads, on-device intelligence, and clear consent flows are replacing opaque tracking. The next generation of app monetization platforms will prioritize privacy while growing revenue, while keeping users comfortable with how their data is handled.
Also Read: Top 15 Mobile App Development Trends for 2026 and Beyond
Partner with 1600+ tech evangelists who’ve shipped 2000+ revenue-generating apps.
How Appinventiv Helps You Build Apps That Actually Make Money?
At Appinventiv, we approach every app as a revenue product, not just a delivery milestone. Our 1600+ tech evangelists have shipped 2000+ applications across 35+ industries, helping clients achieve 100M+ downloads while keeping monetization, user experience, and compliance tightly aligned.
We have partnered with brands like Adidas, KFC, Pizza Hut, Domino’s, 6th Street, and Edamama, where app performance is measured in conversions, repeat usage, and basket value, not just installs.
Recent outcomes include:
- Domino’s: 23% lift in conversions through funnel and checkout optimization.
- KFC: 30,000+ daily orders and 4.5+ ratings after UX modernization.
- Adidas: Multi-million downloads and 500K+ new users across target regions.
- 6th Street: Performance tuning driving 4M+ combined downloads.
- Edamama: Commerce ecosystem powering 100K+ mothers and aiding $5M fundraising.
With an average MVP delivery cycle of 3 weeks and teams operating from 5+ international offices, we are used to working at enterprise scale and speed.
For C-level teams, this translates into a partner that can help pressure-test your mobile app business model, design monetization into the product architecture, and set up the data plumbing you need to track real ROI.
Backed by 15+ global recognitions and 5+ strategic federal partnerships, our mobile app development services focus on moving your app from “well used” to “well monetized” through clear strategy, iterative builds, and measurable revenue outcomes.
FAQs
Q. How to generate revenue from apps?
A. Pick a primary model (subscriptions, in-app purchases, commissions, ads, or B2B licensing), then support it with 1–2 secondary streams. Align pricing to clear outcomes, instrument analytics, and keep optimizing conversion, churn, and ARPU over time.
Q. How to create an app and make money?
A. Validate the problem, define the core value, and decide your mobile app business model before development. Build monetization into journeys from day one, wire in analytics, launch an MVP, then refine pricing and flows based on real user behaviour.
Q. How to make money from apps without ads?
A. Use freemium tiers, subscriptions, in-app purchases, affiliate or referral programs, transaction commissions, enterprise licensing, or lead-generation models. These options keep the interface clean while tying revenue directly to the value or outcomes your app delivers.
Q. How much money can a free app make?
A. A free app with weak engagement might earn almost nothing. A high-retention product with strong monetization can generate anywhere from cents per user (simple ads) to hundreds of dollars per customer lifetime in B2B or marketplace scenarios.
Q. What are the most profitable ways for mobile apps to generate revenue in 2026?
A. In 2026, the strongest patterns are AI-tuned hybrid models: subscriptions plus in-app purchases, light ads on free tiers, transaction fees in marketplaces, and B2B monetization through enterprise plans, licensing, and embedded financial services wrapped around the core product.
Q. What is the most profitable app monetization strategy?
A. There is no universal winner, but data-backed subscriptions and enterprise licensing typically deliver the highest, most predictable returns. Profitability improves further when you combine them with AI-driven personalization, smart upgrades, and a strong focus on retention and expansion.
Q. What are the legal and compliance challenges in enterprise app monetization?
A. Key risks centre on data privacy, consent, payment processing, taxation, advertising policies, and sector-specific rules (for example, finance or healthcare). Trials, subscriptions, and data usage must be transparent, auditable, and aligned with regional regulations and app store guidelines.
Q. How can AI/ML optimize monetization paths in enterprise-grade apps?
A. AI and ML can predict churn, score conversion intent, personalise paywalls, pick the best plan to show, and tune pricing or offers by segment. Done with guardrails, this lifts ARPU and retention without damaging trust or user experience.

- In just 2 mins you will get a response
- Your idea is 100% protected by our Non Disclosure Agreement.
How Much Does It Cost to Build a Calorie Counting App Like Cronometer in Australia
Key takeaways: Building a calorie counting app with Cronometer-level accuracy in Australia typically costs between AUD 70,000 and AUD 700,000+, depending on data depth, compliance posture, and analytics sophistication. Underestimating compliance, data licensing, and post-launch governance is the most common cause of budget overruns for Australian nutrition platforms. The hard cost driver is not screens.…
MVP to Market: Realistic Cost, Timelines & Tech Stack for MVP App Development in Australia
Key takeaways: MVP development costs in Australia typically land between AUD 50,000 and AUD 200,000+, driven by integration depth, security, and delivery shape. Time-to-market can vary from 8 to 20 weeks, influenced by integrations, compliance, and feature scope. Choosing the architecture and best tech stack for building mvp app early reduces rebuild risk when traction…
Step-by-Step Guide to Digital Tipping Platform Development for Australia: Features, Costs & ROI
Key takeaways: Digital tipping is now a system-level decision Once tips move through digital payments, they intersect with payroll, reporting, and workforce trust. Informal handling does not scale. Sector-specific design determines success Cafés, restaurants, hotels, delivery services, and franchises each require different allocation logic and operational controls to reflect how work is delivered. Cost reflects…