


Exploring the Power of AI in Creating Dynamic & Interactive Data Visualizations

- How AI is Transforming Data Visualization Techniques?
- Unlocking Data’s Potential: Key Capabilities of AI for Data Visualization
- Industry-Wise Use Cases and Real Examples of AI-Powered Interactive Data Visualizations
- What Are the Key Benefits of AI in Data Visualizations?
- What are the Trending AI Data Visualization Tools in 2025 & Beyond?
- The Cost of an AI-based Data Visualization
- Future Trends Of AI in Data Visualization
- Appinventiv: Your Trusted Partner for Crafting AI-Driven Data Visualization Solutions

Key takeaways:
- AI transforms data visualization by providing automated insights, interactive dashboards, and NLP, thereby tackling revenue loss and improving data quality.
- Key features include predictive analytics, real-time data integration, and user-friendly visualizations, enabling faster and more informed decisions.
- Top 2025 tools, such as Tableau, Power BI, and Julius AI, offer NLP and real-time analytics for all users.
- Benefits include real-time decisions, scalability, and predictive insights across finance, healthcare, and retail.
- Costs range from $20,000 (MVP) to over $ 1.5 million (enterprise), with annual maintenance fees of $10,000 to $100,000.
- Future trends: AR/VR visualizations, explainable AI, and personalized dashboards for immersive data experiences.
The core of business decision-making, and ultimately the success of the business, lies in the data. However, today’s AI-driven hyper-innovated landscape is highly data-saturated. 402.74 million terabytes of data are created every day. They are either complex or unstructured, making it difficult for businesses to understand and identify opportunities. And this has brought the following challenges in the past few years:
- Revenue loss: IBM Big Data & Analytics says that poor data management costs the US economy $3.1 trillion annually.
- Delayed Decision-Making: According to the CIO, 70% of organisations still struggle with managing and integrating IoT data, emphasising the ongoing need for specialised data integration tools.
- Poor Data Quality: Forbes claims that 79% of enterprise executives agree that poor-quality big data will put their competitive position at risk.
However, the old-school approach for visualizing this complex data has now failed to grasp the dynamic nature and complexity of the data. That’s where you need AI for data visualization, which not only revamps data visualization insights but also completely shifts the data representation approach from static to dynamic.
How AI is Transforming Data Visualization Techniques?
AI tools for data visualization have surpassed traditional systems with simple dashboards and smart business intelligence (BI), which is adaptable to a changing data environment, and have established a solid platform in autonomous intelligence. This autonomous intelligence, powered by predictive analytics and complex machine learning algorithms, is capable of analyzing vast data streams on demand and identifying insightful trends, while presenting user-friendly visualizations of actionable data.
That’s why the Data Visualization Market is projected to reach USD 18.36 billion by 2030, driven by advanced automated capabilities.
This blog explores how AI is reshaping data visualization, its key capabilities, applications, benefits, and the future of this powerful synergy.
Get an AI-powered custom data visualization system now

Unlocking Data’s Potential: Key Capabilities of AI for Data Visualization
Manual structuring of overwhelming complex data is like being in a maze that takes a considerable amount of your productivity and resources. However, AI in data visualization has reversed that, allowing anything but organized data to be turned into comprehensible information promptly and accurately, enabling anyone to extract the maximum value from their data easily.
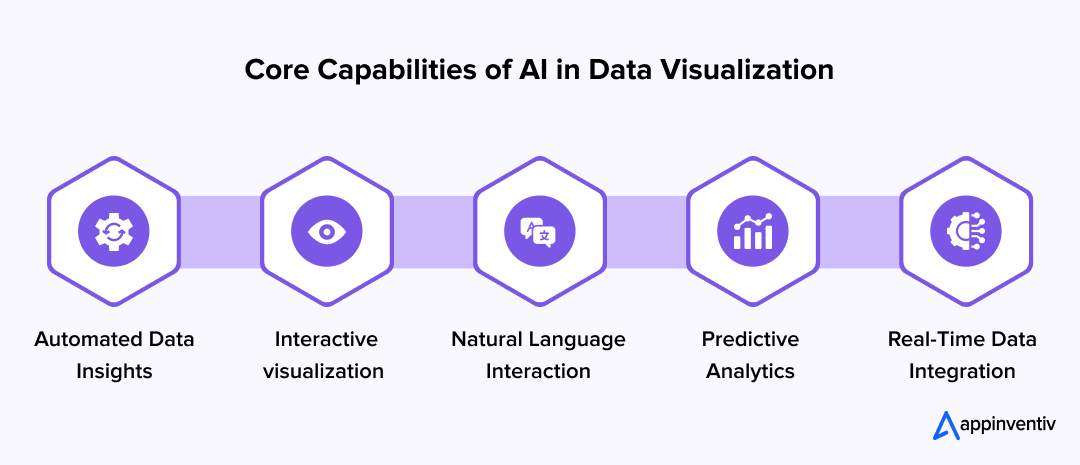
Automated Data Insights
Using AI for advanced data visualizations enables users to automate essential processes, including analyzing vast amounts of information and identifying patterns, trends, or anomalies. Additionally, AI automates insights from data into a manageable form, such as abstract and vivid diagrams.
The system leverages machine learning algorithms, such as decision trees and neural networks, to analyze both structured and unstructured data, identifying the key drivers within the data.
- Scans to identify the significant patterns
- Ranks insights by relevance
- Generates natural language summaries or visual cues
Interactive visualization
Automation powered by AI has completely transformed the game of data visualization. Generative AI data visualization enables businesses to convert complex data into interactive visualizations, empowering deeper analysis through response to clicks, filters, and queries, without any technical assistance.
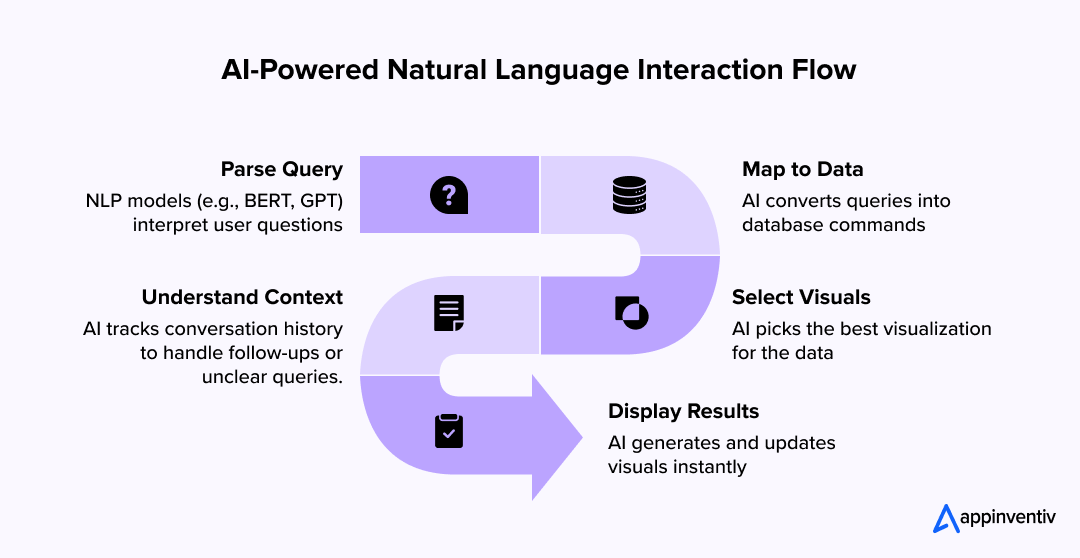
This is how AI enables interactive visualization in simple steps:
- Understand Input: AI leverages NLP to understand the user queries or clicks.
- Interpret Context: AI also leverages contextual models to deeply interpret the user’s context and ensure accurate responses to the actions.
- Create Visuals: Based on the inputs, AI instantly creates real-time graphs and charts.
- Optimize Chart Type: Reinforcement learning analyzes the gravity of the situation and picks the best chart type.
- Make the graph interactive: AI predicts needs, offering relevant filters or drill-down options to enhance the user experience.
Natural Language Interaction
The applications of NLP have brought a new experience to the table – Natural Language Interaction, which has simplified the way to interact with data. Now, businesses can converse and interact with complex data effortlessly using simple, conversational language, without needing to engage in complex SQL queries and coding. For example, you want to know the sales in the first quarter. You don’t have to be involved in coding, simply ask or write – “What were the sales of the first quarter?”
Predictive Analytics
The traditional data dashboard only provides users with historical data on which they base their decision-making in business activities; however, this decision-making process is not suitable for long-term planning. Nevertheless, data visualization and AI have now transformed the outcome of decision-making.
With the potential of predictive analytics, AI provides insightful and futuristic information that can be used to make informed business decisions, streamline business operations, and fill gaps.
Artificial intelligence can employ time-series forecasting methods (e.g., ARIMA, LSTM) or be regression-based to account for past effects and predict future outcomes. It takes into account every single variable, such as seasonality and external conditions, and the results can be given as the trend line, confidence interval, or as a scenario chart.
Real Time Integration
Real-time data integration is also a powerful capability that allows for integrating dynamic and current data streams, which is necessary to keep the visualizations up-to-date and accurate. It enables AI to access, collect, and analyze data from various sources, including APIs, IoT devices, and databases.
- AI makes the data coming into the system instantly understandable, with no delay.
- This process enables real-time processing, allowing for visualization in the form of dashboards, charts, or maps.
- The functionality will enable users to make informed decisions at the opportune moment in a high-stakes environment, as it allows them to make reasoned and current insights.
Due to the increasingly enormous amount of data available, analytics must be represented visually and be immediately comprehensible. AI algorithms need to extract pertinent facts and the platform should enable the user to go from a macro picture to a granular analysis in one click.
By Ludovic Gallen, Co-founder at Data Impact by NielsenIQ
Industry-Wise Use Cases and Real Examples of AI-Powered Interactive Data Visualizations
AI data visualization tools are transforming the way industries make sense of, respond to, and prosper from data. These tools are revolutionizing the way fields operate, changing the strategy and driving innovation by converting complicated datasets into actionable and even predictive knowledge that is easy to understand and simple to work with directly. We discuss AI in data visualization applications across seven major industries: Finance, Healthcare, Manufacturing, Retail and E-commerce, Energy, Automotive, and Electric Vehicles.

Finance
AI tools for data visualization advance the way the finance industry handles or interprets the data. Users can easily evaluate large datasets, including market trends, transactions, and customer behavior, to present interactive dashboards.
In conjunction, machine learning aids in fraud detection, while Natural Language Processing (NLP) generates narrative summaries and provides visualizations in the form of heat maps, enabling users to make data-informed decisions and giving financial analysts a competitive advantage.
Real Example: JPMorgan Chase’s COiN Platform
JPMorgan Chase relies on data visualization to track market risks and trade strategies using enhanced AI. The COiN platform they developed requires AI for interpreting financial documents and visualizing data representations. (Source: COiN)
Healthcare
Data visualization and AI are used in the medical field to process medical records (e.g., medical files, imagery, or genetic information) to generate visualizations, such as 3D printing in healthcare, visual imagery of the organization of an organ, or risk maps. Using deep learning, patterns can be found in medical images, and AI in healthcare data visualizations can keep the progress of patients or the use of resources in a hospital updated in real-time, helping to make clinical decisions.
Real Example: Siemens Healthineers
Siemens Healthineers utilizes AI in healthcare data visualizations to present medical imaging data, employing deep learning to identify anomalies in CT scans and MRIs, which can be displayed to radiologists via an interactive 3D model. (Source: Siemens Healthineers)
Manufacturing
AI-enhanced data visualization has revolutionized the data analysis approach of manufacturers, enabling the visualization of sensor data collected by IoT applications in manufacturing devices and monitoring production lines, anticipating failures, and streamlining processes. The AI algorithms generate real-time reports on the performance of machines, defect levels, and bottlenecks in the supply chain, which are commonly displayed in visuals through augmented reality (AR) on-site.
Real Example: General Electric (GE)’s Predix Platform
General Electric (GE) has its Predix platform, which generates interactive dashboards to visualize machine health and identify maintenance requirements, utilizing AI. (Source: Emerj)
E-commerce and Retail
The use of AI in e-commerce data visualization involves analyzing information about customers, sales patterns, and stock levels to generate visualizations, such as heat maps showing the movement of the audience through the shops or recommendation charts with each customer having a unique set of product suggestions. eCommerce analytics can be used to identify the demand, and AI-based sentiment analysis creates visualizations of customer feedback.
Real Example: Amazon
Amazon leverages AI to analyze customer buying trends and optimize its inventory on dynamic dashboards, thereby making its supply chain more efficient.
Energy
The energy sector utilizes AI tools for data visualization to provide a visual representation of data in smart grids, renewable energy generation, and consumption patterns, thereby identifying the most effective way to distribute the generated energy. The machine learning predicts demand spikes, and the data visualization AI dashboards provide a real-time display of grid performance and trends in carbon, aiming to make the grid more sustainable.
Real Example: Shell
Shell deploys AI to visualize data collected from oil rigs and renewable sources, creating dashboards used to monitor efficiency and reduce emissions. (Source: Shell)
Automotive
The automotive sector leverages AI for data visualization to visualize automobile sensor data, assembly-line data, and collision-test data, thereby enhancing both design and safety. The simulations based on artificial intelligence generate 3D models of the vehicle performance, whereas dashboards monitor the supply chain or telematics information to manage the fleet.
Real Example: BMW
BMW relies on AI to visualize data from crash tests and accelerate vehicle design optimization with the help of interactive 3D simulations. (Source: Wards Auto)
Electric Vehicles
In electric vehicles (EVs), data visualization AI can be implemented to visualize strategies for optimizing battery performance, charging modes, and driving modes. The range and maintenance are forecasted by machine learning, which is presented through dashboards in the cars or mobile apps that display real-time charts of energy consumption.
Real Example: Tesla
Tesla utilizes AI in the visualization of battery life and driving statistics, enabling drivers to view current range and recharge time estimations on interactive in-car screens. (Source: Digitaldefynd)
Unleash AI data visualization to redefine your industry, mirroring the innovation of JPMorgan, Siemens, and Tesla.

What Are the Key Benefits of AI in Data Visualizations?
In the era of data, companies depend on the insights that can be put into practice to remain competitive. The power of data visualization AI has changed the way companies use and analyze data. With analytics data visualization, businesses can reap significant benefits. The following section outlines the key business advantages of generative AI data visualization.
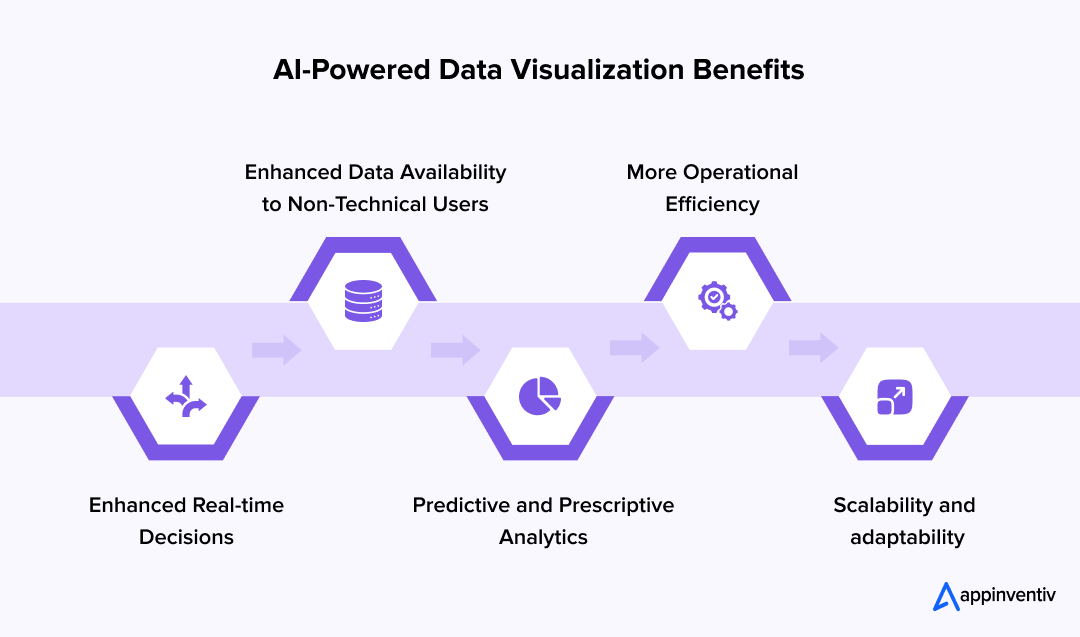
Enhanced Real-time Decisions
AI in data visualization enables businesses to detect trends, patterns, and anomalies in their data. Unlike fixed charts, an interactive dashboard with an AI application would allow for more in-depth navigation into a particular point of data, asking questions, and receiving answers in real-time.
As an example, a retail organization can monitor the performance of sales depending on geographical areas and change variable inventory with the help of AI-based insights. This is achieved at speeds and accuracies that enable high-speed, informed decisions.
Enhanced Data Availability to Non-Technical Users
AI in data visualization also simplifies data complexity through NLP and its informative interface. Those workers who are non-technical can interact with visual replies and contact them through a conversational request, e.g., by saying “Display me sales trend in Q3.”
These requests are digitized or transformed into dynamic graphs or charts by the AI system, hence democratizing data access across teams. That allows marketing, sales, and operations staff to make informed decisions based on the data and do not need data scientists to participate in business.
Bonus Read: Best Data Visualization Practices for Businesses
Predictive and Prescriptive Analytics
Additionally, as a second distinctive feature, AI provides prompts for visualization based on predictive models that estimate future trends and offer prescriptive recommendations on how to respond to them. For example, a logistics company can utilize AI to predict delivery delays and receive recommendations for route optimization. By visualizing scenarios and conducting what-if analyses, businesses can proactively respond to challenges positively and capitalize on potential opportunities, thereby creating a competitive advantage.
More Operational Efficiency
Generative AI for data visualization encompasses the entire process of data processing, cleansing, and concept creation, along with which trained machines can assist analysts in generating insights quickly. It is possible to determine the most effective way of displaying data, including the right charting or coloring, through ML algorithms. Automation enables the data team to be engaged with high-level goals, resulting in increased reporting cadence and workflow systems across various organizations.
Scalability and Adaptability
The AI data visualization tools can support growth by spanning the colossal amount of new data and business requirements just as well. Whether a company is dealing with thousands or billions of data points, AI ensures that its visualizations are lightning quick and accurate.
Further still, when it comes to new sets of data or market dynamics, AI just learns a new way but knows how to provide more insight. Ultimately, this adaptability contributes not only to long-term growth but also to flexibility.
“Data visualization is a great way to simplify data and show it in a form that is understandable, insightful, and actionable. Data visualization is being increasingly seen as the vital final step of any successful data-driven analytics plan.”
By Caroline Lee, Author
What are the Trending AI Data Visualization Tools in 2025 & Beyond?
In 2025, Generative AI for data visualization is revolutionizing the way businesses and individuals process and display data, with an emphasis on automation, natural language processing (NLP), up-to-date information, and user-friendliness for non-technical audiences. Some of the most prominent AI data visualization tools and the most innovative ones according to the current trends are provided below with their peculiarities.

Tableau
Tableau remains a leading company, offering features such as Agentic Analytics and Concierge, which enable natural speech analysis through natural language queries. It features AI-powered capabilities, such as Data Pro, which simplify the process of modeling and creating visualizations, making it ideal for enterprise-level dashboards.
Key Features:
- NLP to search the data in plain English (e.g., Show sales trends by region).
- Color Ranges that are dynamic to point out trends and outliers.
- Slack and Salesforce back support on actionable insights in work.
- Data cleaning via AI and data visualization recommendations.
Microsoft Power BI
The strong connection with the Microsoft ecosystem and Copilot AI makes Power BI easy to access and powerful. Its Smart Narratives will automatically create brief observations in easily understood English, and its ease of use is due to its drag-and-drop convenience, which both amateurs and professionals admired.
Key Features:
- NLP natural language query and explanations.
- Automatic data preparation and trend detection via the integration of Azure AI.
- In-time analytics and dashboards that are customizable.
- Integrates with Excel, Azure, and other Microsoft tools without any problem.
Bonus Read: A Complete Guide to Enterprise Business Intelligence
Google Looker Studio
It is a free, cloud-based program, and therefore, it integrates with the Google ecosystem (Google Sheets, BigQuery) and supports generative AI data visualization, making the process more democratized. It is user-friendly, and its real-time analytics have made it popular with startups and SMBs.
Key Features:
- Natural language query with conversational analytics and duet AI.
- Online analysis and display.
- Verified insights using Smart data modeling with LookML
- Embedded analytics in integrating dashboards
Zoho Analytics
Zoho Analytics is easy to use and cost-effective, with effective AI and data visualization capabilities, including NLP and predictive statistics. With the use of the Zoho suite of applications, it has been a success among SMBs, as it makes workflow automation more efficient.
Key Features:
- Automatically-made dashboards and natural language querying.
- Anomaly detection and predictive analytics.
- Custom dashboard drag and drop interface.
- Over 500 connections to data sources in Entire environments.
Julius AI
Julius AI is also gaining popularity due to its conversational experience, which enables users to discuss and analyze data through conversational chat windows. It offers multi-LLM (e.g., GPT-4, Claude) support and ready-to-use templates, which is why it is so popular among researchers and small teams.
Key Features:
- Data analysis with visualization made via chat.
- Supports Python, R, and different file formats (CSV, Excel).
- Interactive graphics and animated graphics (GIF).
- Academic discount (50 percent off) and templates of the workflow.
Qlik
The AutoML functionality and generative AI chat (Qlik Answers) feature of Qlik enable building code-free predictive models and data insights personalized to the individual working with unstructured data. It has an associative data engine that is suitable for complex analytics.
Key Features:
- NLP to query and come up with insights.
- AutoML in code-free predictive modeling.
- Intelligent data search and aberration detection.
- Security and strong data integration.
The Cost of an AI-based Data Visualization
The cost of a data visualization system with AI may vary depending on the project, level of complexity, and other factors, such as whether it is custom-built or off-the-shelf. As the insights are available, this is developed further at:
- Simple MVP: $20,000 to $100,000 can result in a project at this cost, and this is a basic platform with very limited capabilities.
- Mid-Tier System: $100,000-$500,000 is a scalable solution that includes NLP, real-time analytics, and custom dashboards.
- Enterprise System: $500,000 – $1,500,000+ for complex, fully customized solutions, integrated with advanced AI (think predictive analytics, computer vision).
- Annual Maintenance: $10,000-$100,000 annually, depending on magnitude and upgrades.
Key Factors Affecting AI Data Visualization Software Implementation Cost
- Complexity: Systems that require NLP, real-time computation, or computer vision (e.g., imaging-based dashboards) may be more expensive due to the increased data and calculation requirements.
- Data Quality: Poorly structured or inferior quality increases preprocessing costs.
- Scale: The larger amount of data managed by the enterprise solutions or the number of users is more expensive.
- Integration Requirements: Due to its connection to multiple data sources or legacy systems, the integration process becomes complex.
Cost-Saving Tips For Developing an AI-powered Data Visualization System
- Obtain an MVP: Construct a minimal system ($20,000 to $60,000) to ensure funds are upscalable.
- Utilize Open-Source Tools: TensorFlow, PyTorch, or Plotly can be used without incurring license costs.
- Choose Cloud: Pay as you go with AWS, Azure, or Google Cloud.
- Outsourcing Development: Recruit in relatively pocket-friendly locations to lower the cost of manpower.
- Plan Data Strategy in Advance: Make investments in clean and structured data to reduce pre-processing expenses.
Consult our experts today for a precise cost estimate of your scalable and sophisticated AI data visualization system.

Future Trends Of AI in Data Visualization
Technological development is bringing an impressive pace to how companies visualize data through AI. With organizations becoming more reliant on data to make intelligent choices, AI is also changing the way they generate, interpret, and interact with visual representations of data.
Here, you’ll explore the most notable future trends in data visualization.
Computer-generated Visualization Generation
AI makes the process of visualization creation more efficient by automating the selection and design of charts. Machine learning (ML) tools enable the processing of data to extract patterns, correlations, and outliers, and suggest the best possible visualization type, such as a bar chart, a heatmap, or a network graph, depending on the data structure and context.
- AI in action: AI algorithms analyze the type of data (e.g., categorical, numerical) and the intention of the user to accomplish visualizations without an input.
- Advantages: No wastage of time, fewer chances of human error, and allows a non-expert to develop professional-quality visuals.
- Future outlook: In the future, it is predicted that AI will also create dynamic and multi-layered visualizations, and changing different information will require a person to update them manually.
Interactive Visualizations using Natural Language Processing (NLP)
NLP is transforming the relationship of users with data visualizations. AI systems offer the advantage of allowing users to query data in natural language and create or adjust visualizations in response to simple queries, such as “Show me the sales trends by region” or “Compare the revenue over quarters.”
- AI in action: NLP models can analyze user requests and extract relevant data fields, rendering pertinent views.
- Advantages: Enables exploration of data through a non-technical interface, accelerating the creation of insights.
- Future outlook: NLP technology will be further developed to handle more conversational and chatty questions, enabling dynamic dashboards to respond to voice or text queries in real-time.
AR & VR Visualizations
AI is also improving immersive data experiences through augmented reality (AR) and VR. Using these technologies, users can interact with 3D data visualizations within virtual environments and gain insight into large or complex datasets.
- AI in action: AI is used to manage large amounts of data to produce 3D models that are to be displayed in an AR/VR and explored interactively.
- Advantages: The possibility of intuitive analysis of multidimensional data, e.g., geospatial or network data.
- Future outlook: With ever-decreasing prices of AR/VR hardware, AI-enabled immersive visualisation will become commonplace not only in healthcare, urban planning, and finance, but also in other fields.
Bonus Read: AR/VR Trends and Predictions For The Upcoming Years
Predictive and Prescriptive Visualization
AI is also transcending descriptive analytics to predictive and prescriptive visualizations. They infer what pattern will be further and prescribe a course of action by showing a picture of the future based on past and ML-based predictions.
- AI in action: Intelligent AI models can control how historical data can be analyzed to make a prediction and create graphics that provide a trend, risk, or even an opportunity.
- Advantages: Enables proactive decision-making by demonstrating the possibilities of what could happen and what should be done.
- Future outlook: There will be increased expectations for AI to incorporate real-time data feeds and external data (such as weather and market trends) to develop hyper-accurate predictive imagery.
Contextual and Persona Visualization
AI will enable hyper-personalized visualizations tailored to the user’s roles, preferences, or goals. Learning to make choices, AI can restrict itself to user behavior and context, specify prioritization of relevant data, and customize visual reports.
- AI in action: AI keeps a record of user activity and preferences to provide dashboards or graphs that prioritize important metrics.
- Advantages: It makes one more efficient as they receive less information, which might otherwise overwhelm and obscure practical details.
- Future outlook: AI will utilize contextual information in real-time (e.g., location, time, or user role) to provide responsive visualizations that adapt to the user’s needs.
Visualizations explainable AI (XAI)
More advanced AI-driven visualizations may involve significant, yet unnoticeable, changes when processing and visualizing data. In contrast, explainable AI (XAI) achieves transparency through the clarity of the data processing and visualization process. This plays an instrumental role in enabling trust in machine-generated knowledge.
- AI in action: XAI will deliver information through annotations or some interactive features that can clarify the logic of various visualizations, including why some patterns were emphasized.
- Advantages: Strengthens the trust and allows the users to confirm AI-powered insights.
- Future outlook: XAI will become a standard capability, and visualizations will incorporate so-called explainability layers that break down the complex AI decisions for the end-user.
“As we move into the future, data visualization will empower people to see and understand patterns and relationships in data more easily, enabling informed decision-making. The future will combine augmented reality, machine learning, and advanced interaction methods to make data more immersive and intuitive.”
By Ben Shneiderman, Professor at the University of Maryland
Appinventiv: Your Trusted Partner for Crafting AI-Driven Data Visualization Solutions
With the aid of artificial intelligence, organizations are empowered to delve deeper for insights, which in turn engage users more effectively and innovate more broadly than they already do. Opening up the field of data interactivity and making it simpler and more effective across industries, AI has reinvented the rules of data engagement, including dynamic dashboards and predictive analytics.
Therefore, you should have tech support from one of the best AI development companies, like Appinventiv, renowned for its bespoke AI services and solutions. We have a decade of experience in developing custom visions that utilize AI technology to convert unstructured information into well-built, highly interactive visuals, enabling intelligent decision-making and fostering innovation across various industries.
Our experience in deploying cutting-edge AI algorithms will make your visualizations brilliant in both aesthetic and engineering dimensions: they will be intelligent, easily adaptable, and responsive to the specific needs of your business.
Whether you’re interested in developing interactive dashboards, a real-time data analytics platform, or AI-powered data visualization systems, our custom-built AI development services enable organizations to create complex, user-centered data visualization systems.
We already have an impressive portfolio and track record of delivering AI-powered solutions to such industry giants as KFC, IKEA, Adidas, and JobGet. Our services are not limited to the digital; we also streamline business processes and, in essence, enable businesses to achieve user-friendly and pleasant data visualization interfaces.
Collaborate with us to discover how we convert your data into an effective tool that can help not only to step up an organization in data storytelling but also help you to stay competitive in the digital environment.
FAQs
Q. How Is AI Transforming the Functionality of Data Visualization Tools?
A. AI transforming functionality of data visualization in the following ways:
- Context-driven visualization: AI understands the business scenario behind the data to craft relevant visuals.
- Voice-enabled exploration: Modern tools now support voice queries to interact with dashboards hands-free.
- Data-to-story conversion: Instead of isolated charts, AI connects data points into logical story flows.
- Proactive trend surfacing: Surfaces insights users didn’t think to ask for, boosting discovery.
- Visual reasoning engines: AI now interprets “why” behind patterns, not just “what.”
- Intelligent drill-downs: Smartly expands visuals to uncover root causes without manual slicing.
- Cross-source fusion: Merges inputs from multiple platforms for a unified visualization experience.
Q. How Does AI Help in Data Visualization?
A. AI help in data visualization in the following ways:
- Speeds up data processing, making visualization faster and more efficient.
- Simplifies complex analysis by automatically detecting patterns and anomalies.
- Personalizes visual insights using machine learning based on data context.
- Recommends suitable chart types to improve clarity and interpretation.
- Enables voice and text interaction with visuals through Natural Language Processing (NLP).
- Explains trends in plain language using Natural Language Generation (NLG).
- Supports real-time and predictive dashboards for proactive decision-making.
- Transforms static visuals into dynamic tools, helping businesses make smarter, data-driven decisions.
Q. How To Use AI for Data Visualizations and Dashboards?
A. AI used in data visualizations and Dashboards in the following ways:
- Connect data sources (CRMs, databases, IoT, APIs) to AI-enabled visualization platforms.
- Use AI to auto-clean and structure data before visual rendering.
- Apply machine learning models to identify trends, clusters, and anomalies.
- Let AI suggest visual formats (charts, heatmaps, treemaps) based on context.
- Enable real-time analytics using streaming data pipelines and live dashboards.
- Use Natural Language Queries (NLQ) to interact with dashboards via voice or text.
- Implement NLG tools to auto-generate plain-language summaries of visual insights.
- Customize dashboards based on user role, behavior, and predictive goals.
Q. How does Data Visualization AI handle large datasets?
A. Data Visualization AI handles large datasets by using advanced machine learning, real-time processing, and dimensionality reduction techniques to simplify complex information. It ensures fast rendering through GPU acceleration and cloud-based scaling, while intelligently summarizing key insights. This allows users to explore massive data volumes seamlessly without compromising performance or clarity.
Q. How to Ensure Security in AI-Driven Data Visualization Platforms in Regulated Industries?
A. To ensure the safety of AI in data visualization systems in regulated environments (e.g., in the healthcare industry, in the financial field):
- Encryption Data: Data in transit and data at rest should be encrypted with AES-256.
- Make Compliant: Follow the GDPR, HIPAA or SOC 2 through audits.
- Anonymize Data: Use confidentiality on sensitive information.
- Safe APIs: APIs that are authenticated and use encryption along with rate limits.
- Track Activity: Have audit trails so as to do traceability.
- Shield AI Models: Revise the algorithms and avoid attacks.
- Epic systems: Epic systems guarantee HIPAA-compliant incident images password-protecting and encrypting. Security is enhanced by testing and training.
Q. How can I get started with data visualization using AI?
A. Step to started with data visualization using AI :
- Learn basics: Understand data visualization principles and AI concepts.
- Choose a tool: Start with user-friendly platforms like Tableau or Power BI.
- Experiment with Python: Use libraries like Plotly or Seaborn with AI models for custom projects.
- Explore tutorials: Follow online courses or tutorials on how companies are reshaping data visualization using AI.
- Practice with datasets: Use public datasets (e.g., Kaggle) to create AI-driven visualizations.
Q. What are the Pros and Cons of AI-Based Data Visualization?
A. Pros
- Faster insight generation with minimal manual intervention.
- Enhanced accuracy through pattern recognition and anomaly detection.
- Smart visualization suggestions tailored to data and user intent.
- Interactive exploration via NLP-driven voice/text commands.
- Real-time and predictive dashboards for proactive decision-making.
- Improved accessibility for non-technical users through NLG explanations.
Cons
- Dependency on data quality—AI outputs are only as good as the input.
- Limited contextual understanding in niche or domain-specific scenarios.
- High implementation costs for enterprise-grade AI visualization tools.
- Reduced human control over creative or nuanced visual storytelling.

- In just 2 mins you will get a response
- Your idea is 100% protected by our Non Disclosure Agreement.

How Much Does It Cost to Build a Conversational AI Chatbot in the UAE?
Key Takeaways AI chatbot development in the UAE typically costs AED 150,000–1,470,000 ($40K–$400K), based on complexity. Backend integration and compliance drive cost more than the chatbot interface itself. Arabic NLP, UAE hosting, and PDPL requirements increase budget and engineering effort. LLM + RAG enterprise chatbots sit at the higher end due to integration and infrastructure…

AI Inventory Management in Australia: Benefits, Use Cases, and Implementation Strategies
Key takeaways: Traditional ERP planning reacts to history; AI predicts demand shifts, reallocates stock dynamically, and prevents costly stockouts across distributed Australian networks. AI in inventory management in Australia typically reduces inventory levels 20–40% while maintaining service targets, unlocking significant working capital across multi-state operations. Enterprise implementations usually range from AUD 70,000 to AUD 700,000+,…

How to Hire RAG Architects for Enterprise AI
Key takeaways: Define your RAG architecture scope to avoid misaligned hiring decisions Identify end-to-end architectural ownership across retrieval, governance, and scaling Evaluate deep technical capabilities beyond prompt engineering and tools Validate governance and compliance readiness at the retrieval layer Test system-level thinking through real-world failure scenarios Choose the right hiring model based on scale, risk,…