































Big Data Analytics for Telecom Operators: From Data to Operational Impacts

 Share -


- 01Telecom Data Analytics Market Overview and Why It Matters in 2026
- 02Types of Big Data Analytics in the Telecom Industry
- 03Key Benefits of Big Data Analytics in the Telecom Industry
- 04Telecom Analytics Use Cases: How to Use Big Data in Telecom
- 05Big Data Analytics Telecom Case Study: How Appinventiv Unified Data for 90M+ Customers
- 06Real-World Examples of Big Data in Telecom Industry
- 07How Data Analytics Works in the Telecom Industry: Reference Architecture
- 08Real-Time Operational and Customer Experience Analytics in Telecom
- 09Telecom Data Monetization: Turning Analytics into New Revenue
- 10Ethics, Data Governance, and Regulatory Compliance
- 11Challenges of Data Analytics in Telecommunications and How to Overcome Them
- 12Implementation Roadmap: How to Leverage Big Data in Telecom Step by Step
- 13Cost of Building a Big Data Analytics Platform for Telecom
- 14Future Trends in Big Data Analytics for the Telecom Industry
- 15How Appinventiv Helped a Telecommunication Company in Their Big Data Journey
- 16FAQs

Key Takeaways:
- Telecom analytics spending is projected to reach $16.2B by 2030 as operators turn network and customer data into decisions.
- Churn, fraud, capacity, and pricing use cases pay back fastest, with analytics-led operators cutting churn by up to 15%.
- A phased rollout reaches production in 4 to 9 months, with platforms costing $50K to $500K based on scope.
- Legacy OSS/BSS integration is usually the largest cost line, so plan it before choosing analytics tools or models.
- Network APIs and anonymized data products turn analytics into new revenue, with Open Gateway covering 80% of mobile connections.
Telecom operators are no longer struggling with data scarcity. The real challenge lies in making sense of it fast enough to keep networks stable, customers satisfied, and margins protected. Every call record, network event, device signal, and customer interaction adds to a growing stream of information that, if left unmanaged, creates noise instead of value.
This is where big data analytics for telecom has moved from being a support function to a core operational capability. When applied correctly, analytics helps operators see pressure points forming across networks, understand why customers churn before they leave, and make pricing, capacity, and service decisions based on real behavior rather than assumptions. The difference is not incremental. It is structural.
Yet, many telecom organizations still struggle to connect analytics to outcomes. Fragmented OSS/BSS systems, rising 5G data volumes, and growing compliance demands often slow progress. The result is analytics that look impressive on paper but underdeliver in practice.
In this guide, we break down how telecom operators can use big data analytics in a practical, scalable way, from high-value use cases and architecture choices to real-world examples, ROI considerations, and what it takes to stay future-ready as networks evolve.
Appinventiv helped a US operator unify data for 90M+ customers. Your subscriber base could be next.

Telecom Data Analytics Market Overview and Why It Matters in 2026
Telecom data analytics is the process of collecting and analyzing call records, network events, OSS/BSS logs, device signals, and customer interactions. Operators use it to improve network performance, reduce churn, prevent fraud, and grow revenue. At the scale of a modern network, this work becomes big data analytics for telecom.
The volume of data on these networks keeps climbing. Mobile network data traffic grew 20% between Q3 2024 and Q3 2025. Average mobile data traffic per active smartphone reached 22 GB per month globally at the end of 2025. During 2025, the share of mobile data traffic carried over 5G rose from 34% to 48%, and 5G subscriptions are now close to 3.3 billion.
Operators are spending more on analytics to handle this growth. The telecom analytics market is projected to grow from $9.3B in 2026 to $16.2B by 2030, at a CAGR of 14.9%.
Manual monitoring cannot keep up with traffic at this scale. Big data analytics in the telecom industry helps operators spot congestion early, flag subscribers at risk of churn, and price plans based on actual usage rather than assumptions.
Types of Big Data Analytics in the Telecom Industry
In telecom, analytics doesn’t arrive all at once. It builds over time. Most operators use a mix of approaches, depending on the decisions they are trying to make and the maturity of their data setup. Understanding these types shows how big data analytics in the telecom industry appears in day-to-day work.
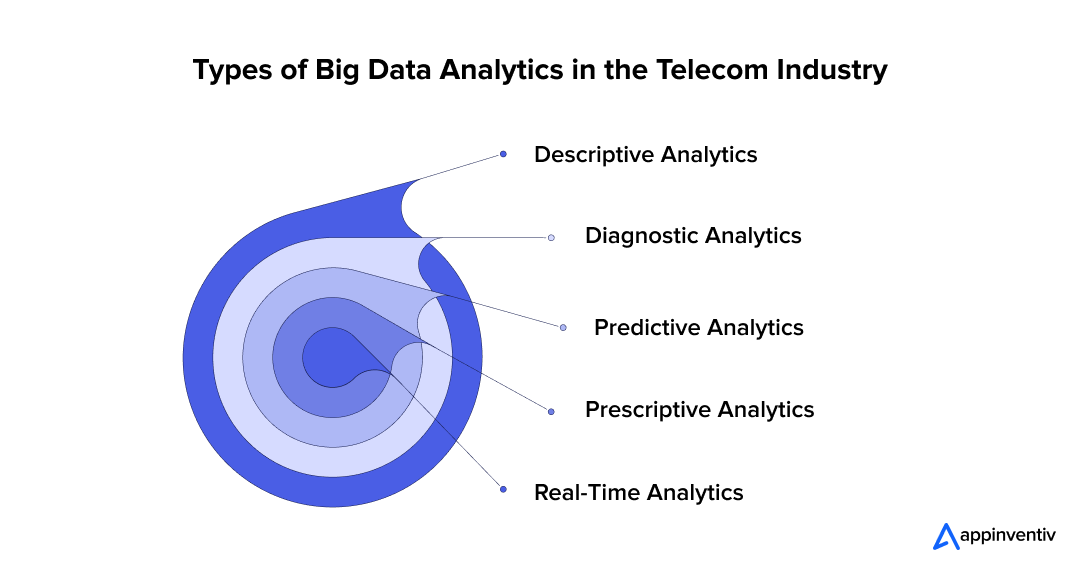
1. Descriptive Analytics: Knowing What Happened
This is usually the starting point. Descriptive analytics looks backward. It helps teams understand what has already taken place across the network and customer base.
It appears in usage reports, traffic summaries, and basic performance dashboards. In the big data in the telecom industry, this level brings visibility, but it doesn’t explain much on its own. It answers “what happened,” not “why.”
2. Diagnostic Analytics: Understanding Why It Happened
Once patterns are visible, questions start to follow. Why did performance dip in a specific area? Why did complaints spike after a rollout? Diagnostic analytics connects dots across systems to get closer to root causes.
This layer is where telecommunications data analytics becomes more useful because it links network behavior, customer actions, and operational events rather than viewing them in isolation.
3. Predictive Analytics: Seeing What’s Likely Next
Predictive analytics looks ahead rather than back. By learning from historical and current data, telecom teams can anticipate what is likely to happen if conditions stay the same.
This is commonly used for churn prediction, demand forecasting, and capacity planning. At this stage, telecom big data analytics starts influencing planning decisions, not just reporting.
4. Prescriptive Analytics: Deciding What to Do About It
Prescriptive analytics goes a step further. Instead of stopping at predictions, it helps recommend actions. In practice, this might mean suggesting bandwidth changes during congestion or identifying which customers should be contacted first.
Here, the use of data analytics in telecommunications is starting to shape real-time decisions, especially in operations and customer management.
5. Real-Time Analytics: Acting as Things Happen
Real-time analytics cuts across all the other types. The focus here is speed. Network events, fraud signals, and service degradation are analyzed as they occur, not after the fact.
For modern telecom analytics solutions, this capability often marks the shift from supportive analytics to systems the business actively relies on.
Key Benefits of Big Data Analytics in the Telecom Industry
The real value of data analytics in the telecom industry is not in dashboards or reports. It shows up in how day-to-day decisions get made. Fewer assumptions and surprises. More control over systems that are otherwise difficult to predict.
One of the first benefits operators notice with big data analytics for telecom is visibility. Network performance, customer behavior, and service quality no longer live in separate systems. Patterns that were easy to miss earlier become obvious once the data are looked at together.
Some of the most meaningful benefits tend to play out in practical ways:
- Networks become easier to manage under pressure: Traffic spikes, regional congestion, and usage anomalies are no longer discovered after customers complain. With telecom analytics solutions in place, teams can identify problems as they form and respond before they escalate.
- Customer relationships improve without heavy-handed retention tactics: Churn rarely happens overnight. When big data in the telecom industry is analyzed over time, it becomes easier to spot early warning signs and address them quietly, often before customers even think about switching.
- Pricing and packaging decisions feel less like guesswork: Instead of relying on broad assumptions, operators can see how different segments actually use services. This is where telecommunications analytics helps balance competitiveness with profitability.
- Decisions get made faster, with fewer internal debates: The use of data analytics in telecommunications reduces dependency on gut instinct. Teams spend less time arguing over numbers and more time acting on them.
- Data starts contributing to revenue, not just operations: As capabilities mature, telecommunications big data opens doors to new partnerships and data-driven services, turning internal insights into external value.
Over time, the benefits of big data analytics in the telecom industry extend beyond efficiency gains. They shape how confidently operators scale, how well they adapt to change, and how closely their services reflect real customer behavior rather than static assumptions.
Telecom Analytics Use Cases: How to Use Big Data in Telecom
The telecom analytics use cases below are ranked by how quickly they tend to pay back. Each one covers the business problem, how operators put it into practice, and the KPIs that prove it worked.
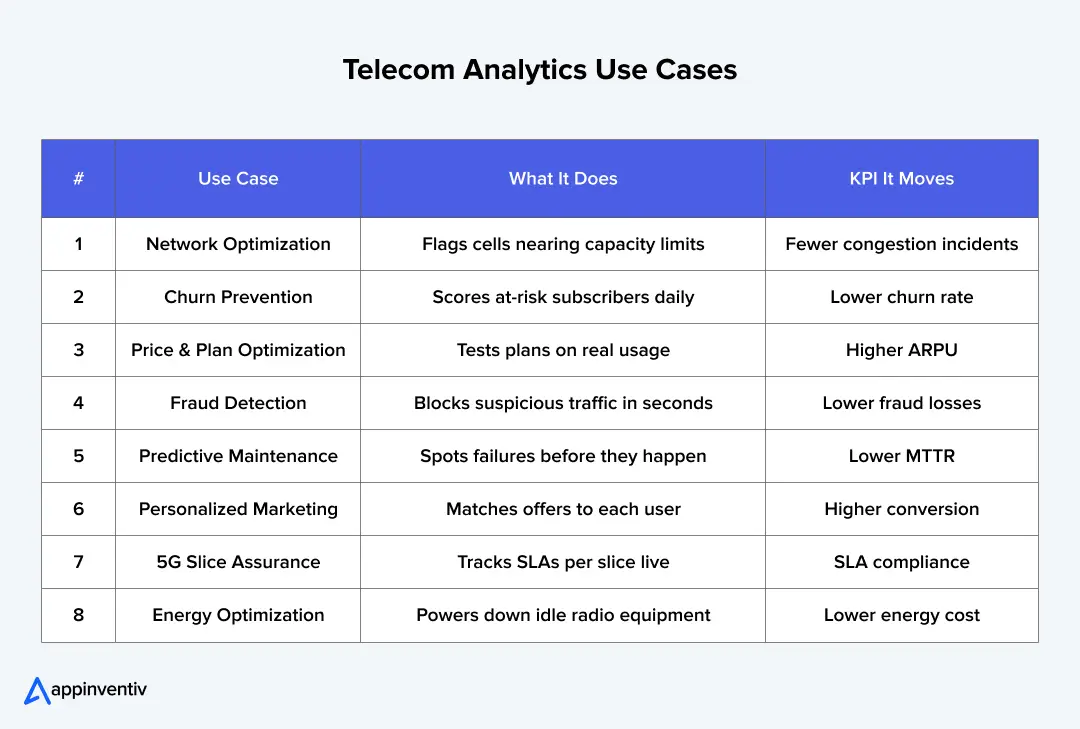
1. Network Optimization and Capacity Planning
The problem: Congestion often shows up first in customer complaints. Capex plans for new capacity are then built on network averages instead of real demand by site.
How it works: Operators stream cell-level KPIs such as throughput, latency, drop rates, and load into a real-time pipeline. Forecasting models compare this live data with historical traffic and flag cells that are close to their capacity limits. The results feed NOC dashboards and the capex planning process.
Outcomes to track: Fewer congestion incidents, faster mean time to detect (MTTD), and capex spent on the sites that need it most.
2. Predictive Churn Prevention
The problem: High-value subscribers leave after a string of poor experiences. No single team sees the full picture, so no one acts in time.
How it works: Operators build one customer view that joins usage, billing, network experience, support tickets, and past offers. A churn model scores every subscriber each day. The retention engine then triggers the right response through CRM, such as a service fix, a credit, or a targeted plan offer. McKinsey found that operators with a comprehensive, analytics-based approach to managing their base can reduce customer churn by 15%.
Outcomes to track: Churn rate by segment, retention offer acceptance, and customer lifetime value.
3. Price, Plan, and Product Optimization
The problem: Plans built on broad assumptions lead to heavy discounting. Margins shrink, and retention does not improve.
How it works: Price-elasticity models study how each segment reacts to plan changes, purchase history, and competitor pricing. A/B tests confirm the results before a full launch. The same usage and feedback data shows which new bundles or add-ons customers want. Integrating data analytics across pricing, product, and network teams keeps these decisions tied to real behavior.
Outcomes to track: ARPU uplift, margin per plan, upsell conversion, and adoption rate of new products.
4. Fraud Detection and Revenue Assurance
The problem: Fraud still costs operators billions each year. The CFCA estimated global telecom fraud losses at $38.95 billion, or over 2.2% of global operator revenue.
How it works: Real-time scoring of CDRs and signaling data catches patterns such as SIM swap, international revenue share fraud, and Wangiri calls. Machine learning models learn from confirmed fraud cases, and rules engines block or hold suspicious traffic within seconds. A Chinese mobile operator built an app called Sky Shield on this model. It used big data, AI, and a police database of fraud cases to prevent fraud in the telecom sector by intercepting spam calls and texts.
Outcomes to track: Fraud losses as a share of revenue, detection time, and false-positive rate.
5. Predictive Maintenance
The problem: Equipment failures cause unplanned outages and costly emergency field visits.
How it works: Models learn the alarm and performance patterns that precede a failure. The system flags at-risk equipment and schedules repairs or replacements during a planned maintenance window. According to TM Forum, operators running AI-driven operations report that automated monitoring cuts mean time to repair by 60% and predictive analytics reduces outages by 40%.
Outcomes to track: Unplanned outages, truck rolls, and mean time to repair (MTTR).
6. Personalization and Targeted Marketing
The problem: Generic campaigns waste budget and convert poorly, both for new subscribers and for upsells to existing ones.
How it works: Operators segment subscribers by behavior, value, and device. Recommendation engines then match each user with the right plan, add-on, or content offer. They combine collaborative filtering, based on what similar users choose, with content-based filtering, based on each user’s own profile. Offers go out through the app, SMS, or care channels at the moment of highest intent.
Outcomes to track: Campaign conversion rate, cost per acquisition, and add-on revenue per user.
7. 5G Network Slicing and SLA Assurance
The problem: Enterprise customers pay for guaranteed performance on 5G slices, and operators must prove they delivered it. Ericsson counted 65 commercial offerings based on 5G standalone network slicing by November 2025.
How it works: Analytics track latency, throughput, and availability for each slice in real time. Models predict SLA breaches and trigger automatic resource changes. Customer-facing dashboards show enterprises the performance they paid for.
Outcomes to track: SLA compliance rate, penalty payouts avoided, and revenue from premium slices.
8. Network Energy Optimization
The problem: Energy is one of the largest network costs. GSMA Intelligence puts it at 20 to 40 percent of telco opex. It found that a 10 to 20 percent cut in energy costs can lift EBITDA by 2 to 4 percent.
How it works: AI models study traffic patterns by site and hour. They put idle radio equipment into sleep mode during low-traffic periods and wake it up ahead of demand. Energy data flows into the same platform as network KPIs, so teams can check that savings don’t hurt service quality.
Outcomes to track: Energy cost per site, kWh per GB carried, and carbon emissions against targets.
Big Data Analytics Telecom Case Study: How Appinventiv Unified Data for 90M+ Customers
The client: one of the largest US-based telecom holding companies, operating for over 30 years. It offers voice, IP, fixed-line, wireless broadband, mobile, and cable services.
The problem: The client collected more than 50 million events from many sources, but the data sat in silos with poor quality and consistency. Teams could not track churn, estimate customer lifetime value, or personalize offers with any confidence.
What Appinventiv built: A cloud data platform on AWS, built with Spark and Hadoop, with ETL pipelines feeding into a single master repository. That repository gives a 360-degree view of more than 90 million customers. On top of that, BI dashboards and AI/ML models segment customers by behavior, power churn tracking and enable personalized recommendations.
The impact:
- 85% increase in data quality and accessibility
- 26% reduction in license, hardware, and maintenance costs
- 100% availability of customer data to every department
Read the full big data analytics telecom case study
Real-World Examples of Big Data in Telecom Industry
Some of the biggest telecommunication companies already treat big data for telecom as core infrastructure. Their work shows how big data applications in the telecommunications industry deliver results at scale.

Here are a few real-world examples of big data applications in the telecommunications industry that have been utilizing data analytics to their full advantage.
Vodafone
Vodafone runs all its analytics on Google Cloud through Nucleus, a global data platform that consolidates data from many systems into a single place. A system inside it called Dynamo lets Vodafone launch personalized services across markets faster. In October 2024, Vodafone signed a ten-year deal with Google worth over USD 1 billion to build machine learning applications on this data.
( Also read: AI in Telecom – Exploring the Key Business Benefits, Use Cases, Examples and Challenges)
Deutsche Telekom
Deutsche Telekom’s RAN Guardian Agent, built with Google’s Gemini models, has been live in Germany since November 2025. It watches the network during traffic surges and fixes congestion on its own. It has cut the time needed to manage major events from hours to about a minute, an improvement of more than 95%.
Reliance Jio
Reliance Jio crossed 130 million customers within its first year after launch, according to a letter from Chairman Mukesh Ambani reported by Business Today. Jio uses big data analytics for real-time, location-based views of user behavior, which supports digital transformation initiatives that improve the customer experience across its ecosystem.
Knowing how companies use big data is one part of the picture. The architecture underneath decides whether it works at scale
How Data Analytics Works in the Telecom Industry: Reference Architecture
In telecom, architecture decisions often surface as operational problems later. Data volumes grow faster than expected. Systems that work at one scale start to break at another. That’s why analytics architecture is less about tools and more about how well everything holds together under pressure.
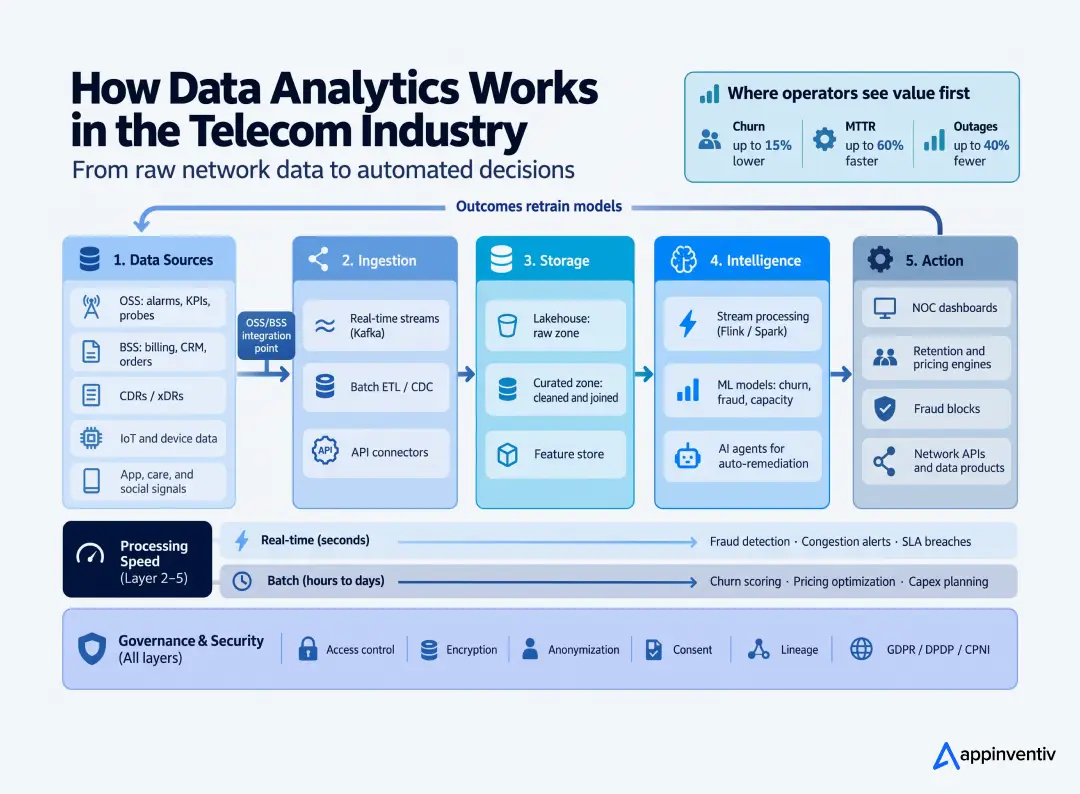
1. Handling Data as It Arrives
Telecom data does not come in neat batches. Network events, call records, OSS/BSS logs, and customer interactions all move at different speeds. Some signals need attention immediately, others only matter over time. A practical big data analytics setup for telecom accounts for both real-time streams and slower batch pipelines, allowing them to coexist without stepping on each other.
2. Keeping Data in One Place That Actually Works
Scattered data slows teams down. Most operators eventually move toward centralized storage, often a data lake for data management or similar setup, to make sense of telecommunications big data without duplicating it across systems. The goal here is not elegance. It’s consistency. Everyone works from the same numbers, even if they use them differently.
3. Turning Raw Data into Usable Insight
Processing layers are where telecom data analysis happens. They clean data, join sources, and prepare it for analysis. This is what allows telecom analytics solutions to scale without affecting live network operations. On top of that, analytics and machine learning models help teams spot trends, predict issues, and plan ahead, using telecom big data analytics services rather than relying on hindsight.
4. Security, Governance, and Legacy Reality
Telecom systems rarely start from scratch. Legacy OSS/BSS platforms are always part of the picture. A workable architecture respects that reality. OSS/BSS Data Analytics needs to integrate cleanly, without creating security gaps or disrupting billing and operations. Access controls, encryption technology, and data tracking are built in early, because fixing them later is far harder.
When done right, this kind of setup does not draw much attention. That’s usually a good sign. It quietly supports decisions, keeps systems stable, and allows telecommunications data solutions to grow without constant rework. Over time, the architecture stops being a limitation and becomes a foundation that teams can rely on.
Real-Time Operational and Customer Experience Analytics in Telecom
In telecom, network performance and customer experience are tightly linked. When something breaks or slows down, customers feel it immediately. That’s why real-time analytics for the telecom industry has moved beyond operational dashboards and into the experience layer.
With big data analytics for telecom, operators can track network behavior in real time and listen to how customers respond. Usage spikes, congestion, and service degradation can be seen in real time, not hours later, through reports. This allows teams to act while issues are still contained.
On the operational side, telecom big data analytics supports:
- Live monitoring of traffic patterns and network load
- Early detection of congestion and performance anomalies
- Dynamic bandwidth allocation during peak usage periods
- Faster coordination between network operations and support teams
At the same time, customer-facing signals add important context. Data from support tickets, call logs, app feedback, and social channels often reveal issues before they manifest as formal outages. This is where telecommunications analytics bridges the gap between systems and people.
From a customer experience standpoint, analytics helps operators:
- Detect negative sentiment tied to specific locations or services
- Prioritize issues based on customer impact, not just technical severity
- Respond proactively to service complaints and quality drops
- Improve experience consistency across regions and user segments
When combined, the use of data analytics in telecommunications shifts teams from reactive problem-solving to proactive service management. Network health and customer sentiment are no longer treated as separate concerns. They inform each other, leading to quicker resolutions, fewer escalations, and a more stable service experience overall.
Telecom Data Monetization: Turning Analytics into New Revenue
Connectivity revenue is flat for most operators. The data already flowing through their networks is one of the few assets that can open new income. Big data analytics for telecom turns that data into products that businesses pay for. Four models lead in 2026:
- Network APIs: Operators charge per call for SIM swap checks, number verification, device location, and quality on demand. Banks and fintechs use these APIs to stop fraud at login and payment. GSMA Open Gateway now covers 292 networks and 80% of mobile connections, so developers can buy one API across many operators. Selling at this scale requires secure APIs and strict usage controls.
- Location and mobility data products: Aggregated, anonymized footfall and movement data helps retail, real estate, logistics, and tourism teams choose sites and plan demand. Operators sell this data as subscriptions or one-off studies.
- Advertising and audience segments: Consent-based segments help brands reach the right customers. Operators earn through revenue share with ad platforms.
- Enterprise analytics services: Operators package network and IoT data into paid dashboards for fleet tracking, private 5G performance, and smart city programs.
Revenue from these models depends on a clear data inventory, privacy-by-design anonymization, and consent management. Pricing usually follows one of three models: subscription, pay-per-API-call, or revenue sharing with partners.
The fastest return often comes from inside the business. The same data that powers churn models, upsell offers, and fraud prevention protects revenue the operator already earns.
Open Gateway covers 80% of mobile connections. Every quarter you wait, partners sign with another operator.
Ethics, Data Governance, and Regulatory Compliance
In telecom, data is never just technical. It reflects how people move, communicate, and use services every day. Once big data analytics for telecom starts shaping real decisions, how that data is handled becomes just as important as what insights it produces.
As big data in the telecom industry efforts expand, most problems do not come from tools or platforms. They come from grey areas. Unclear access, loose usage rules, or decisions that push a little too far. Governance exists to prevent such situations before they become trust issues.
In day-to-day terms, good governance usually looks like this:
- Access is limited by purpose: Teams see only what they need. Well-designed telecom analytics solutions avoid “open access” by default.
- Customer privacy is treated as a baseline: Aggregation, anonymization, and consent are non-negotiable when working with telecommunications big data.
- Insights can be traced back to their source: When analytics affects pricing, service quality, or support decisions, teams must be able to explain how those insights were formed. This keeps telecommunications analytics grounded and defensible.
- Local regulations are taken seriously: Analytics in the telecom sector has to align with regional data laws such as GDPR, India’s DPDP Act, and FCC CPNI rules, not just internal guidelines.
Ethics often shows up in small choices. Just because analytics highlights an opportunity does not always mean it should be acted on. Responsible telecom big-data analytics involves knowing when to stop.
When governance is built into daily operations, it no longer slows teams down. Instead, it helps telecommunications data solutions grow steadily, protect customer trust, and avoid problems that are much harder to fix later.
Challenges of Data Analytics in Telecommunications and How to Overcome Them
Big data analytics can be a potent source of insights for the business, though it has multiple challenges. Every challenge would be addressed with practical solutions to ensure successful adoption. Here are some of them:
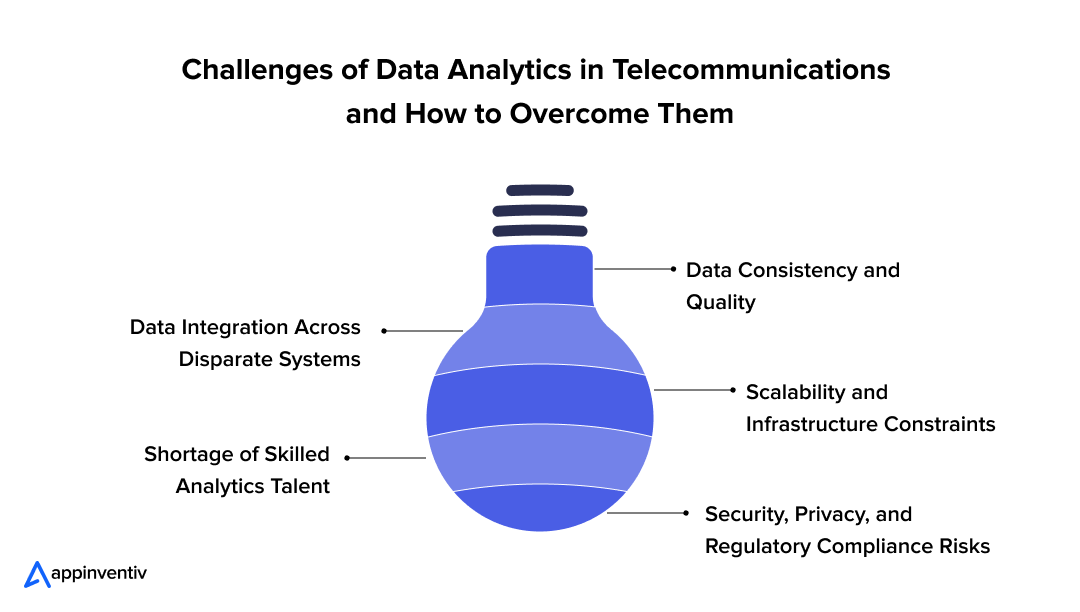
Data Consistency and Quality
Challenge: Data that is inconsistent, missing or inaccurate will diminish the utility of analytics. The low quality of the data leads to erroneous insights and poor business decisions.
Solution: Adopt powerful data governance procedures that involve data cleansing, validation, and standardisation across all sources. Maintain data integrity with automated tools.
Data Integration
Challenge: Data in organizations is usually distributed across various systems, databases, and formats, thus integration becomes challenging.
Solution: Consolidated information using ETL (Extract, Transform, Load) tools or data lakes. Make use of open standards and APIs to simplify integration and guarantee interoperability.
Scalability and Infrastructure
Challenge: Handling large quantities of data requires robust infrastructure, which can be economically demanding and complex to operate.
Solution: Take advantage of demand-scaling cloud-based analytics services. Select distributed processing models, such as Hadoop or Spark, to compute with big data effectively.
Skilled Workforce Shortage
Challenge: Skilled professionals capable of managing, analyzing, and interpreting big data are in short supply.
Solution: Invest in existing employee training and consider hiring a specialized data scientist or an analytics consulting agency. Promote cross-functional teams to work together to get a greater understanding.
Security and Privacy Issues
Challenge: The information stored in big data systems is sensitive, increasing the risk of breaches, non-compliance with regulations, and the loss of customer confidence.
Solution: Adopt powerful encryption, access controls, and anonymization. Make sure that you are complying with laws regarding the protection of data (e.g., GDPR regulations in the EU/UK) and perform regular security audits.
Implementation Roadmap: How to Leverage Big Data in Telecom Step by Step
Most telecom analytics programs fail for one of two reasons. Either the scope is too wide, or no business owner is tied to the outcome. The best way to leverage big data in telecom is a phased rollout, which fixes both problems. Each phase delivers something usable, and each result justifies the next round of spend.
| Phase | Key activities | Typical timeline |
|---|---|---|
| Discovery and use-case selection | Audit data sources, OSS/BSS systems, and data quality. Pick one or two use cases with clear KPIs and a named business owner. | 3–6 weeks |
| Data foundation | Set up ingestion pipelines, lakehouse storage, and data quality rules. Connect priority OSS/BSS systems and define access policies. | 2–4 months |
| Pilot | Build the first models, such as churn scoring or congestion forecasting, on live data. Connect the output to one real workflow. | 6–10 weeks |
| Production rollout | Harden pipelines, add model monitoring and MLOps, and train teams. Push results into CRM, NOC, and pricing tools. | 2–3 months |
| Scale | Add new use cases on the same data foundation. Introduce AI agents, partner data products, and network APIs. | Ongoing |
Most operators reach a production-ready platform in 4 to 9 months. Enterprise-wide programs across many use cases often run for more than 12 months.
A few rules keep the roadmap on track:
- Start with the fastest payback: Churn, fraud, and network stability are the telecom analytics use cases that show measurable results within the first two quarters.
- Build the data foundation once: Operations, marketing, and planning teams should share the same pipelines and features instead of building their own.
- Set baseline KPIs before the pilot: Without a baseline, no one can prove the pilot worked.
- Pair internal teams with a specialist partner: Your teams know the network, and an experienced partner shortens the build cycle.
Cost of Building a Big Data Analytics Platform for Telecom
The cost of telecom data analytics depends on five things: data volume, number of use cases, OSS/BSS integration effort, real-time requirements, and deployment model. The ranges below reflect typical project scopes.
| Scope | What it includes | Indicative cost |
|---|---|---|
| Pilot | One or two use cases, limited data sources, cloud-native stack | $50K – $100K |
| Mid-scale platform | Real-time and batch pipelines, three to five use cases, core OSS/BSS integration | $100K – $250K |
| Enterprise-grade platform | Multi-region setup, full OSS/BSS integration, AI models at scale, advanced governance | $250K – $500K |
What drives the budget:
- OSS/BSS integration: Legacy billing and network systems are usually the largest single cost line. Older platforms with poor API support need custom connectors.
- Real-time processing: Streaming pipelines for fraud or congestion detection cost more to build and run than batch reporting.
- Deployment model: Cloud lowers upfront spend. On-premises or hybrid setups are common in jurisdictions where data residency laws apply, and they increase infrastructure costs.
- Compliance scope: GDPR, India’s DPDP Act, and CPNI rules add work for anonymization, consent tracking, and audit logs.
- Ongoing operations: Cloud usage, model retraining, and support typically add 15 to 25 percent of the build cost each year.
How to measure ROI: The impacts of big data show up first in operations, through fewer outages, faster repairs, and lower churn. Compare outcome metrics against total cost of ownership. Track churn rate, fraud losses, outage minutes, mean time to repair, and ARPU from a fixed baseline. Operational savings usually appear first. New revenue from data products and network APIs follows once the platform matures.
Get a scoped estimate for your telecom analytics platform, from a $50K pilot to enterprise rollout.

Future Trends in Big Data Analytics for the Telecom Industry
Telecom analytics is moving from reports to autonomous systems. Five trends will shape big data for telecom in 2026.
- Agentic AI and Level 4 Autonomous Networks: A TM Forum survey found that 81% of operators target Level 4 autonomy by 2030, where networks fix most issues without human input. This builds on AI-based intelligent automation, and data quality sets the limit on how far it can go.
- Network APIs as a Revenue Channel: GSMA Open Gateway now covers 292 networks and 80% of mobile connections. Operators sell SIM swap checks, number verification, and quality on demand through these APIs.
- 5G Standalone and Network Slicing: More than 90 operators have launched 5G standalone networks. Each slice sold with a performance guarantee needs real-time analytics to prove its SLA.
- Energy-Aware Autonomous Operations: Rakuten Mobile’s autonomous RAN management reduced RAN energy use by about 20% in live operation, based on site- and hour-level traffic forecasts.
- AI-Native 6G and Sensing Data: 6G will add integrated sensing and communication (ISAC), introducing a new class of data to telecom platforms.
Also read: How is Cloud Computing Helping the Telecom Industry Grow?
How Appinventiv Helped a Telecommunication Company in Their Big Data Journey
Appinventiv partnered with a telecom operator facing scattered data and uneven quality across teams. Nothing was technically “broken,” but nothing worked smoothly either. The first step was to simplify how data was stored and accessed. A cloud-based environment, supported by Apache technologies, helped bring disparate data streams into a single place and set up a dependable data analytics service that could keep pace with daily network and customer activity.
Once the foundation was stable, the focus shifted to usability. ETL pipelines were implemented to clean and organize incoming data, filtering out noise and prioritizing what actually mattered. This resulted in a centralized repository that gave teams a clear view of more than 90 million customers. Built using an agile approach, the system was designed to adjust as usage patterns and customer behavior changed, rather than locking the business into rigid data structures.
The outcome was straightforward and practical. Data quality and accessibility improved by 85 percent, and customer information became available across departments without manual handoffs or duplication. For telecom businesses investing in analytics alongside modern telecom software development services, this kind of setup makes it easier to scale insights without adding complexity.
We’re poised to help you leverage the potential of 6G, ensuring your business harnesses this next-gen technology for even greater competitive advantage. If your data feels harder to manage as your network grows, a focused analytics foundation can make a real difference. Appinventiv can help you take that step with clarity and control. Hire our experts. We will cover all your needs!
FAQs
Q. What does a telecom big data analytics platform include?
A. A telecom big data analytics platform has six core layers:
- real-time and batch data ingestion
- central storage such as a data lakehouse
- a processing layer
- machine learning models
- dashboards and decision engines
- a governance layer
The platform connects to OSS/BSS, CRM, and network systems. It pushes results back into operational tools like the NOC, retention engines, and fraud controls.
Q. How to use big data in telecom?
A. Start with one high-value use case such as churn prevention, fraud detection, or capacity planning. Connect OSS/BSS and customer data into a central platform, build a model, and push its output into a live workflow like CRM or the NOC. Add new use cases on the same data foundation once the first one shows measurable results.
Q. How do telecom companies integrate analytics with OSS and BSS?
A. Operators integrate analytics with OSS and BSS through APIs, change data capture, event streaming, and ETL pipelines. TM Forum Open APIs reduce the custom work involved. The platform reads data without disrupting billing or provisioning, then sends results back into operational workflows. Older systems with weak API support usually need custom connectors, which makes integration the largest cost line in most projects.
Q. How long does it take to implement telecom analytics?
A. A pilot with one or two use cases takes 2 to 3 months. A production-ready platform with core OSS/BSS integration takes 4 to 9 months. Enterprise-wide programs across many use cases often run for more than 12 months. Data quality and the state of legacy systems have the biggest effect on the timeline.
Q. What is the cost of building a telecom analytics platform?
A. Building a telecom analytics platform costs between $50K and $500K. A pilot costs $50K to $100K. A mid-scale platform with real-time pipelines and core OSS/BSS integration costs $100K to $250K, and an enterprise-grade platform costs $250K to $500K. Integration effort, real-time needs, and the deployment model drive the final budget more than analytics tools do.
Q. Should telecom analytics run in the cloud, on-premises, or hybrid?
A. Most operators choose hybrid. Cloud gives elastic scale and faster deployment, which suits model training and less sensitive workloads. Subscriber data under data residency rules often stays on-premises. Latency-critical processing for fraud, congestion, or IoT runs at the network edge, close to users, to cut response times and offload the core network.
Q. How can telecom companies use AI with big data analytics?
A. Big data gives AI the foundation it needs to make decisions at scale. Operators use AI for churn prediction, fraud detection, predictive maintenance, network energy savings, and personalized offers. AI agents now go a step further and fix network issues on their own. AI in telecom delivers the most value when it sits on clean, governed data.
Q. How do you measure ROI from telecom analytics?
A. Set baseline KPIs before the pilot, then track the change against total cost of ownership. Common metrics include churn rate, fraud losses, outage minutes, mean time to repair, ARPU, and campaign conversion. Operational savings usually show up first. Revenue from data products and network APIs follows once the platform matures.
Q. What should telecom companies look for in a big data analytics partner?
A. Look for proven telecom experience, including a relevant big data analytics telecom case study with measurable results. The partner should have hands-on OSS/BSS integration skills, depth in real-time and AI engineering, and strong security and compliance practices. A phased delivery model tied to business KPIs matters more than a long list of tools.
Q. What data points matter most in the telecom industry?
A. The most valuable data points are:
- call detail records (CDRs)
- network metrics such as latency, throughput, packet loss, and congestion
- customer usage patterns
- subscriber and device data
- IoT data
- support tickets and sentiment
Combining network and customer data gives the clearest view of both service quality and churn risk.
Q. How is 5G changing data analytics in the telecom sector?
A. 5G increases the speed and volume of network data and moves analytics closer to real time. 5G standalone networks add network slicing, where each slice carries a performance guarantee. Operators need real-time analytics to prove those SLAs, predict breaches, and process data at the edge for latency-sensitive services.
Q. How do telecom companies handle data privacy in big data analytics?
A. Operators protect privacy through anonymization, aggregation, purpose-based access controls, and consent management. Each telecom data analytics use case is reviewed against regional laws before launch. These laws include GDPR in the EU, India’s DPDP Act, and FCC CPNI rules in the US.
Q. What are the key applications of big data analytics in the telecom industry?
A. Key applications include:
- network optimization and capacity planning
- predictive maintenance
- churn prevention
- fraud detection
- price and plan optimization
- personalized marketing
- 5G slice assurance
- network energy savings
These applications help operators cut costs, protect revenue, and deliver more reliable service.


Fast 2-minute response, fully NDA-protected.

Data Analytics for Government: Use Cases, Benefits and Implementation Strategy
Key takeaways: Data analytics can help government move from reactive reporting to evidence-based, proactive decision-making. The highest-value use cases are those directly connected to public outcomes, resource efficiency and operational priorities. The next stage is AI-enabled and real-time government, where analytics, simulation and intelligent systems support faster and more anticipatory decisions. Australian government agencies generate…

How to Hire Data Engineers for Your Enterprise? All You Need to Know
Key takeaways: Hiring data engineers individually slows execution and increases delivery risk at enterprise scale. Partnerships give faster access to senior talent without long recruitment cycles or retention issues. Cost depends more on capability and responsibility than salary alone. The right hiring model directly affects business speed, stability, and ROI. Partnering with experienced teams converts…
How Data Analytics is Shaping the Future of UK Businesses Across Sectors
Key Takeaways Data has moved from support to strategy. UK companies no longer treat analytics as an add-on; it’s shaping how they forecast demand, design products, and compete for customers. Every sector is finding its own rhythm. From retail and healthcare to energy and education, organizations are using data differently, but the goal is the…